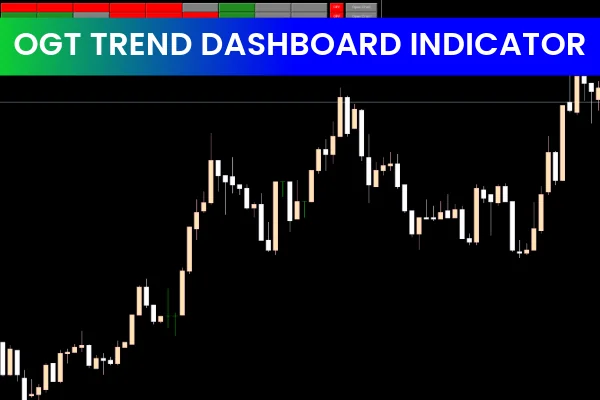
The OGT Trend DashBoard Indicator for MT5 is a powerful forex trading tool designed to help traders instantly identify BULL or BEAR market conditions. It provides GREEN and RED signals based on three core Moving Averages: fast, medium, and slow. This combination allows traders to quickly read trend direction and incorporate the indicator into any technical trading strategy. Whether you trade intraday or swing, this trend dashboard helps you make informed BUY and SELL decisions with confidence.
Understanding the OGT Trend DashBoard Indicator
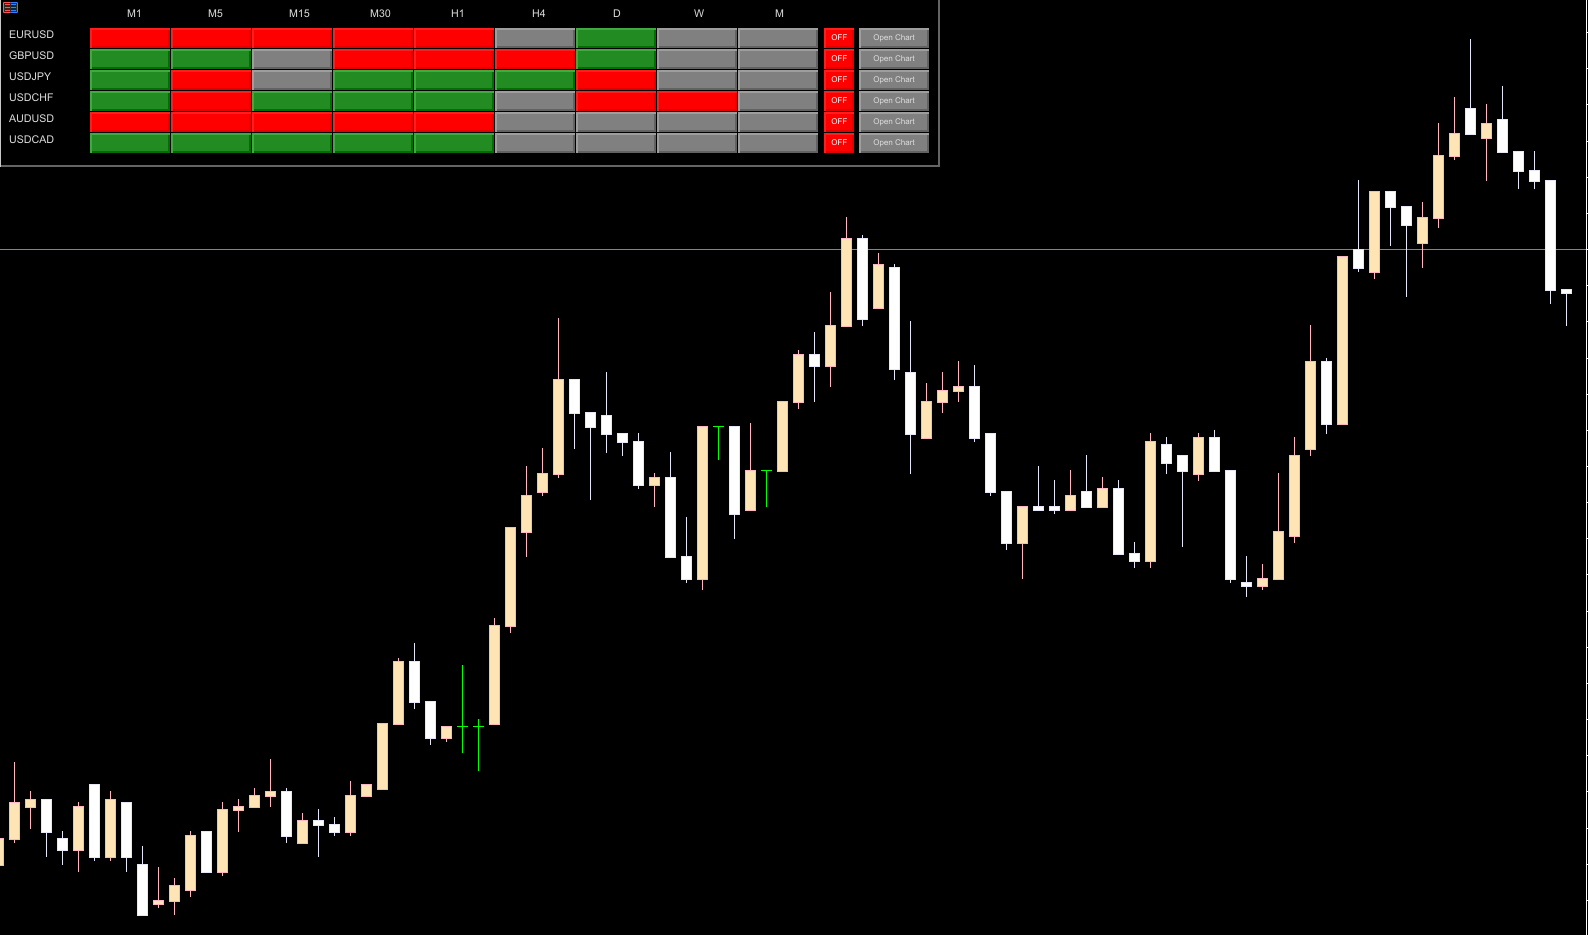
The OGT Trend DashBoard Indicator for MT5 displays trend information for multiple currency pairs and all available timeframes at once. Traders can filter and select only the currency pairs and timeframes they want to monitor. A convenient quick-access button on the right side of the board allows users to open a new chart instantly.
This makes it an ideal choice for beginners learning trend-based systems as well as experienced algorithmic traders using MetaTrader 5, online trading platforms, or MT4 expert advisors. The indicator is easy to install, free to download, and integrates well with most forex trading setups.
Key Features of the Indicator
Clear BULLISH and BEARISH trend detection
Multi-timeframe (MTF) analysis
Works with fast, medium, and slow Moving Averages
GREEN and RED trend signals
Monitors many currency pairs at once
Customizable display
Quick chart-open button
How to Use the OGT Trend DashBoard Indicator for MT5
Trading with Trend Confluence
The best way to use the OGT Trend DashBoard Indicator for MT5 is by combining signals from several timeframes. Traders should first select their preferred trading timeframe. If multiple lower timeframes for a currency pair show aligned bullish conditions, a BUY position is typically the most reliable choice. Stops are usually placed below the previous swing low.
Conversely, when a currency shows bearish alignment across several timeframes—or when multiple pairs involving the same base currency turn RED—traders place SELL positions with stop losses above the previous high. Profit targets can follow a fixed risk-to-reward ratio, or traders can exit trades when the dashboard trend flips from bullish to bearish or vice versa.
Multi-Timeframe (MTF) Trend Trading Strategy
MTF trading is one of the most effective methods when using this indicator. Traders can:
Use a higher timeframe (like D1 or H4) to determine overall trend direction
Use a lower timeframe (like H1 or M15) to find low-risk entry points
The OGT Trend DashBoard Indicator provides a complete overview of all chart timeframes—from intraday charts to daily, weekly, and monthly trends—allowing traders to stay aligned with the dominant market direction.
Practical Example: GBPUSD H4 Setup
On the GBPUSD H4 chart, the dashboard highlights current BULLISH or BEARISH conditions through colored signals. By reading the table, traders can instantly understand the trend of any currency pair on any timeframe without manually opening multiple charts.
This ease of use makes the indicator ideal for algorithmic trading, manual technical analysis, or as part of a broader MetaTrader 5 or MetaTrader 4 trading system.
Conclusion
The OGT Trend DashBoard Indicator for MT5 is a valuable trend-reading tool suitable for traders of all levels. With its clean layout, accurate arrow signals, and multi-timeframe analysis, it simplifies the process of identifying BUY and SELL opportunities. The indicator is free to download, easy to install, and enhances any technical trading strategy.
For more advanced forex tools and trading indicators, visit IndicatorForest.com.
FAQ
1 Download
Published:
Dec 10, 2025 08:18 AM
Category: