The Price Volume Trend (PVT) Indicator for MT5 is a versatile forex trading tool designed to measure trend direction and strength. By combining price movements with trading volume, the PVT indicator offers traders a clear view of market momentum and the balance between supply and demand.
Ideal for both intraday and long-term traders, this indicator helps identify bullish and bearish trends, allowing traders to make informed decisions about when to enter or exit trades. At IndicatorForest.com, you can download the PVT indicator for free and integrate it seamlessly into your MT5 trading platform.
How the PVT Indicator Works
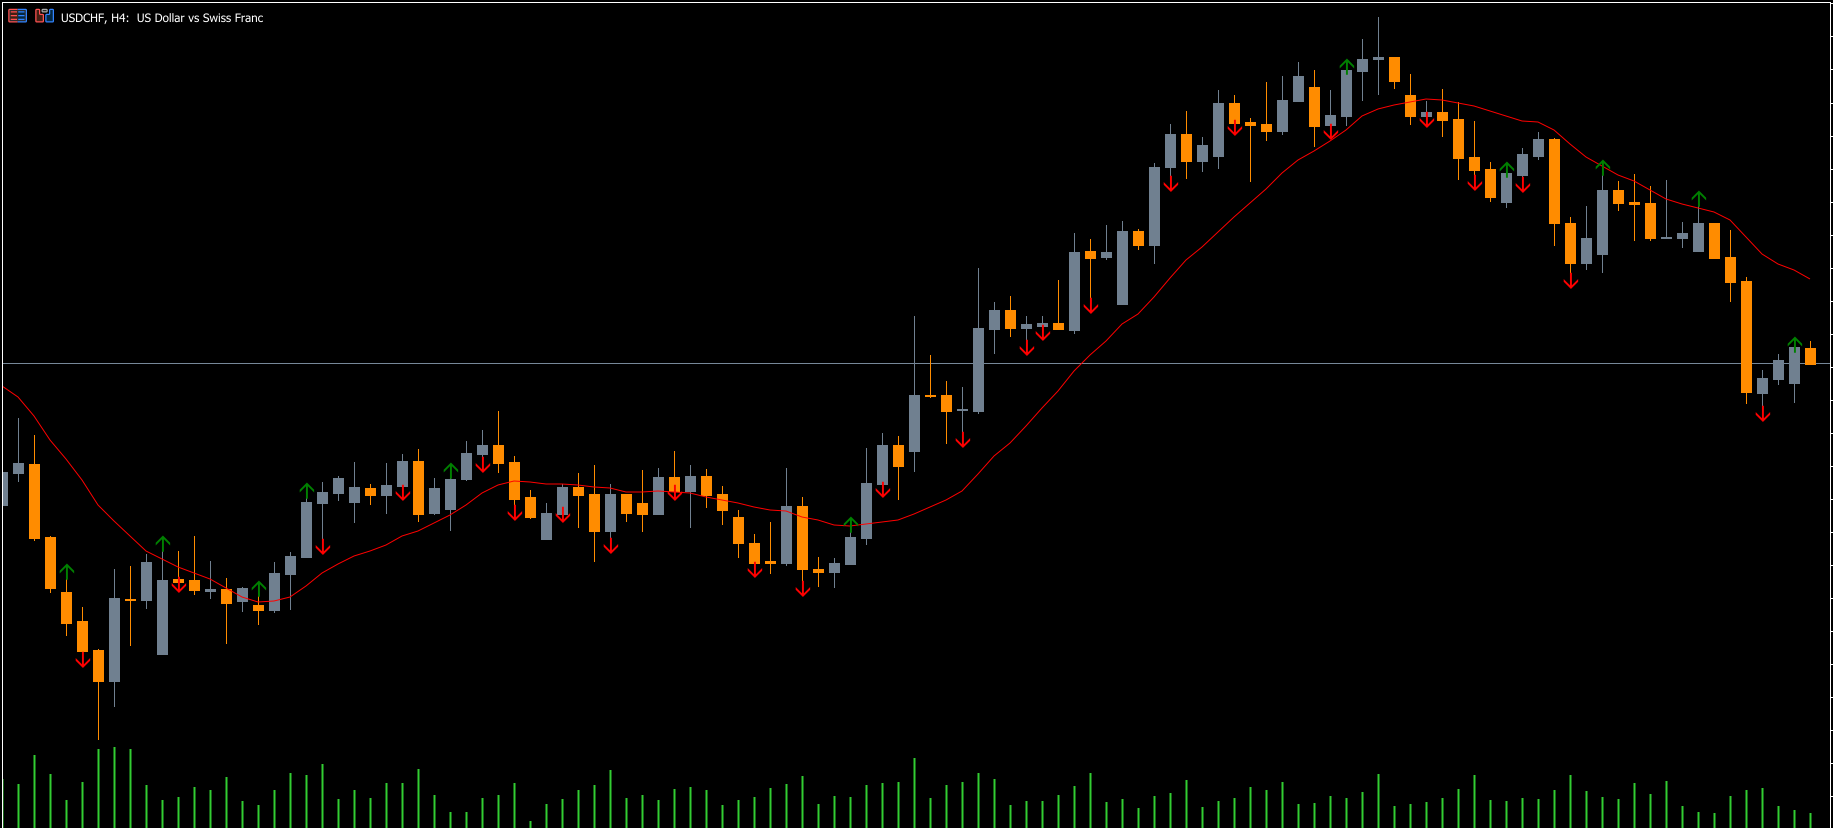
The PVT indicator plots a continuous crimson red line on a separate chart below the main price chart. Its calculation is based on cumulative volume, adjusted by a multiple of the percentage change in price.
When the line rises, it indicates a bullish trend. The higher the line climbs, the stronger the upward momentum.
When the line falls, it signals a bearish trend. The deeper the decline, the stronger the downward momentum.
This combination of price and volume gives traders a more precise understanding of Trend Strength than using price alone.
Interpreting PVT Indicator Signals
1. Bullish Signal (Buy):
Observe the PVT line moving upward.
The trend is confirmed stronger as the line rises faster.
Traders can enter long positions and hold until a reversal is indicated.
2. Bearish Signal (Sell):
Watch for the PVT line moving downward.
The faster the line falls, the stronger the bearish trend.
Traders can open short positions and exit when the line begins to flatten or reverse.
The simplicity of the PVT line allows traders, both beginners and experienced, to quickly identify market trends without complex analysis.
Benefits of Using PVT Indicator
Measures trend direction and strength using price and volume.
Works for intraday, swing, and long-term trading strategies.
Offers a visual representation of market momentum on MT5 charts.
Can be used independently or in combination with other technical indicators like Moving Averages, RSI, or MACD.
Helps traders identify potential trend reversals and strong continuation trades.
Practical Example
On an EUR/USD H1 chart, the PVT indicator shows a steady upward line, signaling a strong bullish trend. Traders could enter long positions while monitoring the line for signs of a reversal. Conversely, when the PVT line declines sharply on GBP/JPY, it indicates a bearish trend, signaling traders to consider short positions.
By using the PVT indicator alongside Support And Resistance levels or trend-following indicators, traders can enhance their trade timing and accuracy.
Conclusion
The Price Volume Trend (PVT) Indicator for MT5 is a user-friendly and effective tool for determining market trends and trend strength. It is suitable for novice and advanced traders and works well on all timeframes, including intraday, daily, and weekly charts.
Whether you are trading forex, commodities, or stocks, the PVT indicator provides valuable insights into market momentum.
Download the PVT Indicator for MT5 for free at IndicatorForest.com and start improving your trend analysis and trading performance today.
FAQ
1 Download
Published:
Nov 12, 2025 00:25 AM
Category: