Trading the Open Markets with the Triple EMA Indicator
In the fast-moving landscapes of the Forex and CFD markets, moving averages stand as the bedrock of trend-following technical analysis. However, retail traders using standard Simple Moving Averages (SMA) or Exponential Moving Averages (EMA) face a constant structural dilemma: lag versus noise. If an indicator is altered to be too fast, it reacts to temporary price whipsaws; if it is smoothed out too much, it alerts traders to a Trend Reversal long after the optimal entry window has closed. The Triple EMA (TEMA) indicator resolves this conflict, providing an ultra-responsive trend line that minimizes mathematical lag without sacrificing smoothness.
What is the Triple EMA Indicator?
Developed by technical analyst Patrick Mulloy, the Triple Exponential Moving Average is an advanced mathematical tool designed to keep pace with volatile price movements. Unlike a basic moving average that simply tracks past price points, the TEMA uses a multi-layered compounding formula. It subtracts the lag out of multiple exponential layers to create a highly accurate, predictive baseline.
The underlying calculation compounds three distinct EMA layers to offset the natural delay embedded in historical time-series data:
$$\text{TEMA} = (3 \cdot \text{EMA}_1) - (3 \cdot \text{EMA}_2) + \text{EMA}_3$$
Where:
- $\text{EMA}_1 = \text{EMA of the price}$
- $\text{EMA}_2 = \text{EMA of } \text{EMA}_1$
- $\text{EMA}_3 = \text{EMA of } \text{EMA}_2$
By mathematically stripping away the compounding lag, the Triple EMA acts as an agile visual guide that tracks real-time Price Action tightly, making it a favorite for intraday scalpers and momentum breakouts.
Interpreting Real-Time Trend Signals
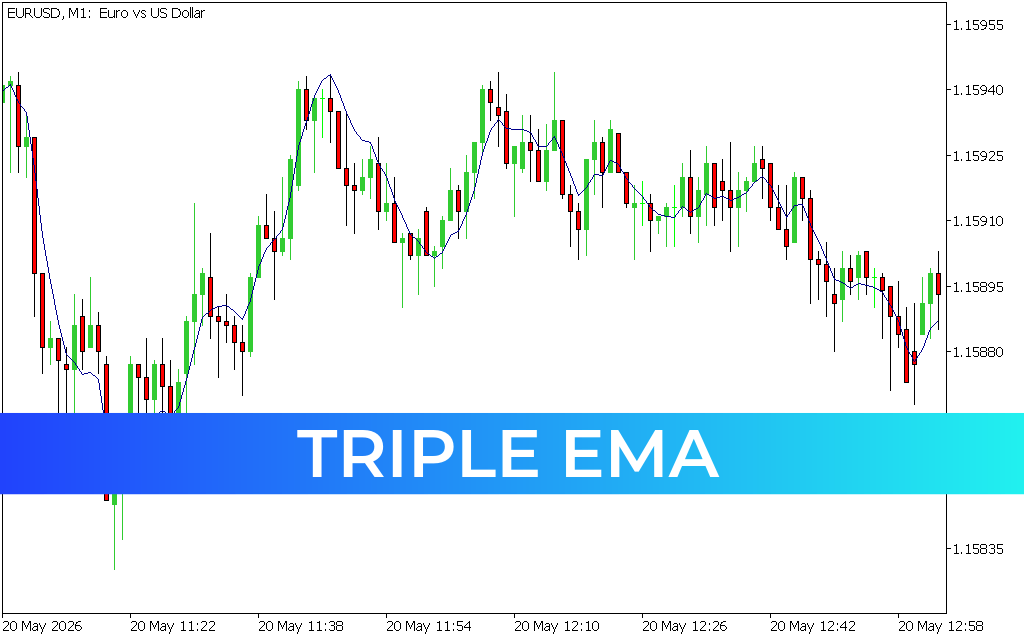
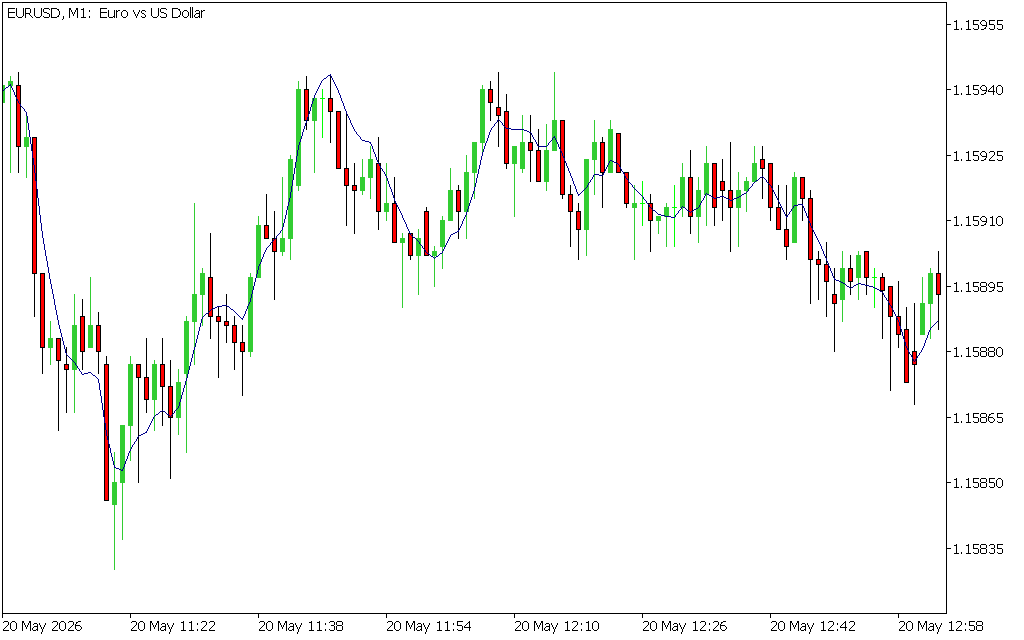
When plotted on highly liquid currency pairs like the EUR/USD across fast-paced execution screens—such as a 1-minute (M1) or 5-minute (M5) frame—the Triple EMA indicator overlays directly onto the primary candlestick grid:
- Bullish Momentum Realignment: When price action pushes firmly above the TEMA line and the line slopes upward, it reveals a dominant bullish market phase. Pullbacks that reject the line from above provide high-probability entry points for trend-continuation plays.
- Bearish Momentum Acceleration: Conversely, when price slips beneath the TEMA line and the slope angles downward, it signals expanding distribution. This environment warns technical analysts to pause long strategies and look for short-selling setups.
- Consolidation Warnings: When the price cuts back and forth across a flat, horizontal TEMA line, it indicates a low-volume range or market squeeze, advising system traders to avoid over-trading.
Optimal Moving Average Trading Frameworks
To optimize the mathematical edge of the Triple EMA indicator within your active MetaTrader platform, apply these core strategies:
- The Dual-TEMA Crossover: Deploy a faster TEMA line (e.g., a 9-period setting) alongside a medium-term TEMA line (e.g., a 21-period setting). Execute long positions when the faster line crosses above the slower line, confirming immediate momentum alignment.
- Dynamic Support And Resistance: In a well-defined macro trend, use a long-term TEMA line (such as a 50 or 100-period anchor) to watch for deep structural pullbacks. Precise candle rejections at the line offer low-risk, institutional value entries.
By eliminating cognitive delay, the Triple EMA indicator simplifies live chart reading, letting you capture fast market trends with rule-based confidence.
1 Download
Last Update:
May 21, 2026 02:47 AM
Published:
Jan 18, 2026 13:41 PM
Category: