Maximize Your Confluence: Ultimate Guide to the Oscillator RSI CCI Sigma Indicator
In technical analysis, relying on a single indicator to make trading decisions frequently leads to false signals and costly market traps. Every oscillator has a unique mathematical vulnerability: the Relative Strength Index (RSI) tracks price velocity, the Commodity Channel Index (CCI) measures deviations from statistical means, and various signal line averages smooth out the underlying momentum.
To achieve true confirmation, professional analysts look for confluence—the exact moment multiple independent tools point to the same market conclusion. The Oscillator RSI CCI Sigma indicator automates this complex cross-referencing process, merging multiple calculation engines into a single, high-probability momentum script.
What is the Oscillator RSI CCI Sigma Indicator?
The Oscillator RSI CCI Sigma is an advanced multi-layered technical indicator that unifies price momentum, trend deviation, and signal smoothing algorithms. Instead of cluttering your charting platform with three separate sub-windows that fragment your focus, this streamlined software processes the mathematics behind the scenes.
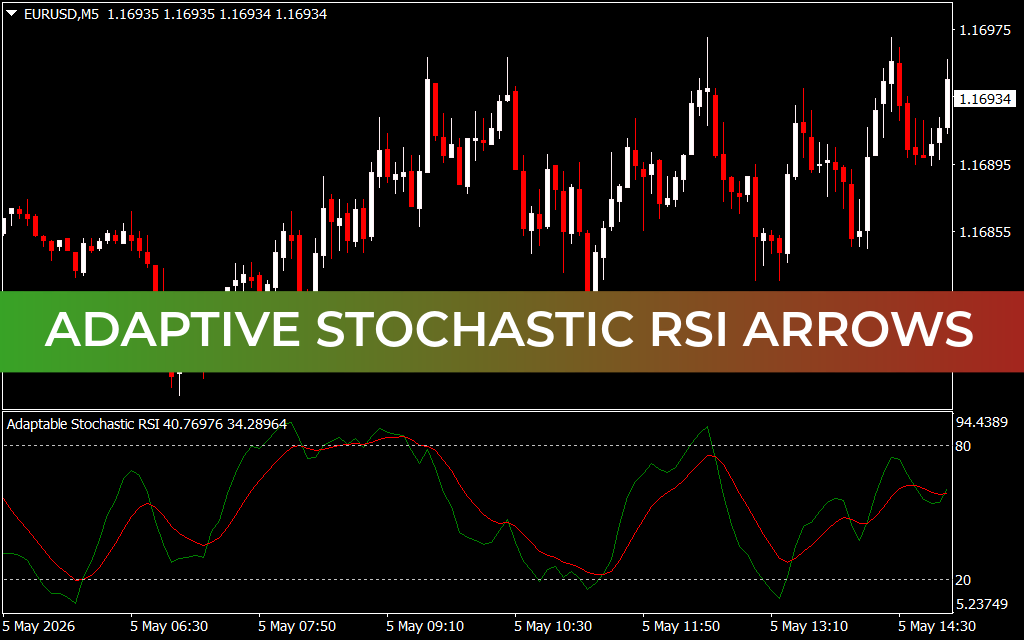
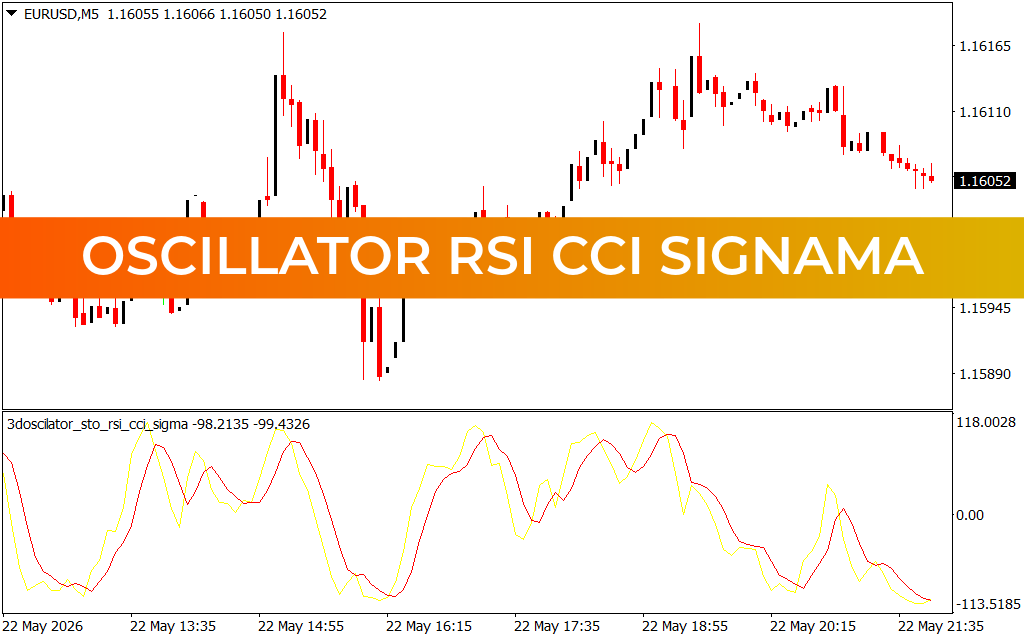
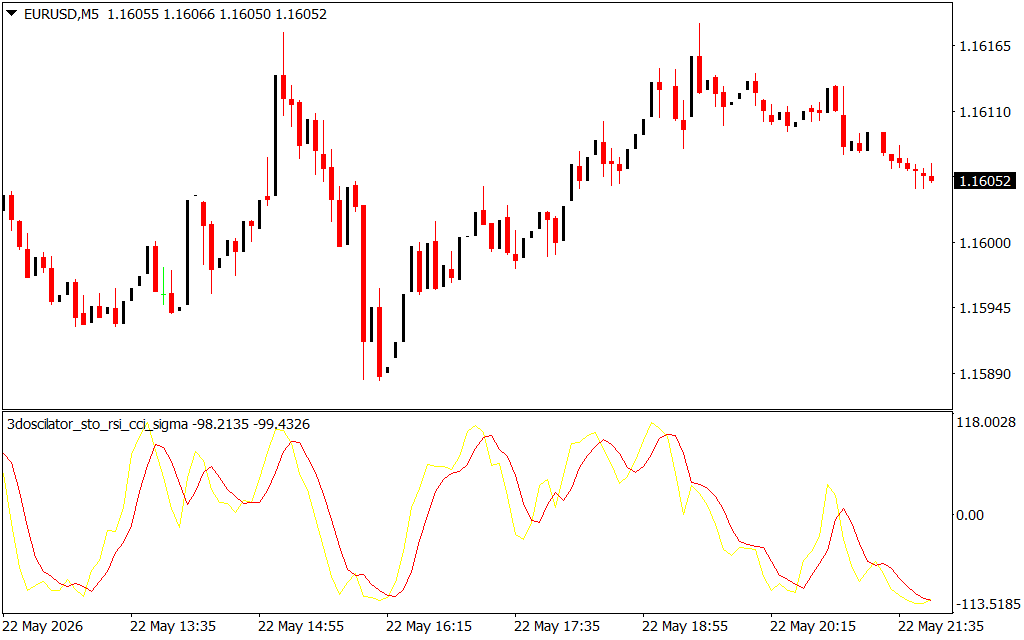
As demonstrated in the EUR/USD 5-minute (M5) chart above, the indicator outputs a clean, dual-line signal wave (3doscillator_sto_rsi_cci_sigma) in a single lower window. The interactions between the highly responsive yellow momentum wave and the smoothed red signal line track real-time institutional sentiment shifts, plotting clear market cycles above and below a central zero equilibrium line.
Key Features and Strategic Advantages
- Algorithmic Signal Confluence: Synthesizes the strengths of RSI and CCI calculations while filtering out the independent mathematical noise inherent to each.
- Smoothed Trend Tracking: The integrated "Sigma" smoothing line acts as a strict volatility filter, helping you stay in winning trends longer without panicking over minor retracements.
- Clutter-Free Optimization: Saves valuable chart space by condensing complex multi-oscillator analytics into two highly legible, overlapping lines.
- Multi-Timeframe Execution: Performs with exceptional accuracy across all charting horizons, from high-frequency intraday M5 setups to long-term swing positions.
How to Trade with Oscillator RSI CCI Sigma
Integrating this powerful confluence tool into your active trading routine simplifies execution logic down to two core techniques:
- The Momentum Signal Crossover: When the faster yellow line breaks cleanly above or below the smoothed red line at structural extremes, it signals an immediate pivot in market control. A bullish crossover near the lower boundary confirms a buying opportunity, while a bearish crossover at the upper peak hints at an impending sell-off.
- Zero-Line Equilibrium Breaks: Tracking how the dual waves interact with the center zero line helps establish broad directional bias. When both lines push firmly above the zero axis, bulls maintain clear control of the trend; when they break below, sellers dominate the market.
To protect your capital and maximize structural win rates, combine these dynamic oscillator crossovers with established horizontal Support And Resistance lines, order blocks, or price action candlestick confirmations.
2 Downloads
Last Update:
May 24, 2026 02:46 AM
Published:
Jan 15, 2026 19:14 PM
Category: