Mastering Market Momentum: A Trader’s Guide to the OsMA Indicator for MT5
In technical analysis, timing is everything. Entering a trend too early can result in getting caught in a painful retracement, while entering too late cuts deeply into your profit margins. For MetaTrader 5 (MT5) traders looking to solve this dilemma, the OsMA Indicator (Oscillator of a Moving Average) serves as a vital tool. By measuring the acceleration and deceleration of price trends, this powerful momentum oscillator helps traders identify subtle shifts in market Supply And Demand before they reflect on the main price chart.
What is the OsMA Indicator?
The OsMA is a classic technical tool derived from the relationship between a primary oscillator and its smoothing line—most commonly, the MACD (Moving Average Convergence Divergence) and its signal line. Mathematically, it calculates the difference between these two values and displays the result as a histogram in a separate window beneath the Price Action.
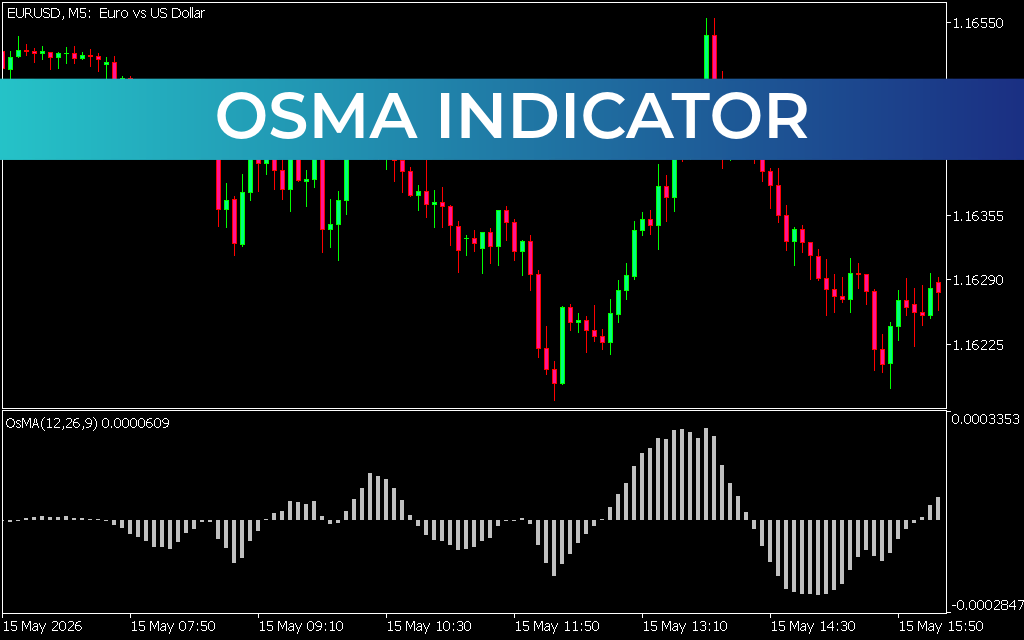
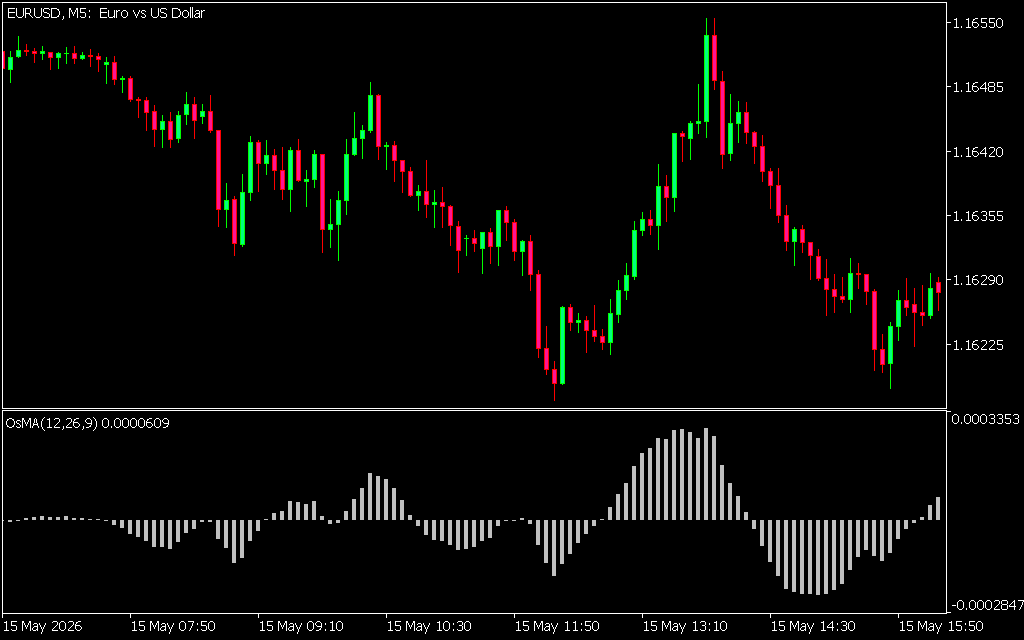
As displayed in the EURUSD M5 chart, the OsMA oscillates around a critical central zero line:
- Bars Above the Zero Line: Indicate that the main oscillator is rising faster than its signal line, reflecting growing bullish momentum.
- Bars Below the Zero Line: Show that the oscillator is falling faster than its signal line, pointing to building bearish momentum.
The height of each individual bar represents the strength of the momentum; expanding bars signify an accelerating trend, while shrinking bars indicate that the current movement is losing steam.
High-Probability Trading Strategies with OsMA
Because the OsMA highlights the rate of change in market speed, it offers highly accurate predictive signals for MT5 users:
- Zero-Line Crossovers: The most straightforward strategy involves tracking when the histogram crosses the central axis. A shift from negative to positive territory signals a fresh bullish buying opportunity, whereas a flip below the zero line confirms a bearish short entry.
- Momentum Divergence: One of the most potent setups occurs when the price action makes a new high or low, but the OsMA histogram fails to mirror it. For instance, if the EURUSD makes a lower low but the OsMA prints a higher low, it signals strong bullish divergence—suggesting a powerful upward reversal is imminent.
- Trend Exhaustion and Exits: Instead of guessing when a trend will end, traders look for the histogram peaks to begin flattening out or retreating back toward the zero line. This shrinking structure serves as an early warning system to lock in profits before a correction begins.
Why Utilize OsMA on the MT5 Platform?
The MetaTrader 5 platform provides the ideal ecosystem for running momentum tools like the OsMA. Thanks to MT5's superior data processing capabilities, the oscillator processes multi-timeframe tick data smoothly, ensuring the histogram reflects exact volume and momentum shifts without lagging behind real-time price delivery.
Conclusion
The OsMA indicator for MT5 transforms complicated moving average behavior into an easy-to-read, actionable histogram. By giving traders a clear window into market acceleration, it acts as an excellent confirmation filter for trend-following and breakout strategies alike.
2 Downloads
Last Update:
May 16, 2026 02:57 AM
Published:
Jan 21, 2026 14:32 PM
Category: