The Parabolic SAR Oscillator for MetaTrader 4 (MT4) is an innovative upgrade to the traditional Parabolic SAR indicator. Created by LuxAlgo, it converts the classic dot-style SAR overlay into a smooth oscillator, offering traders a clearer and more dynamic way to analyze momentum and potential market reversals.
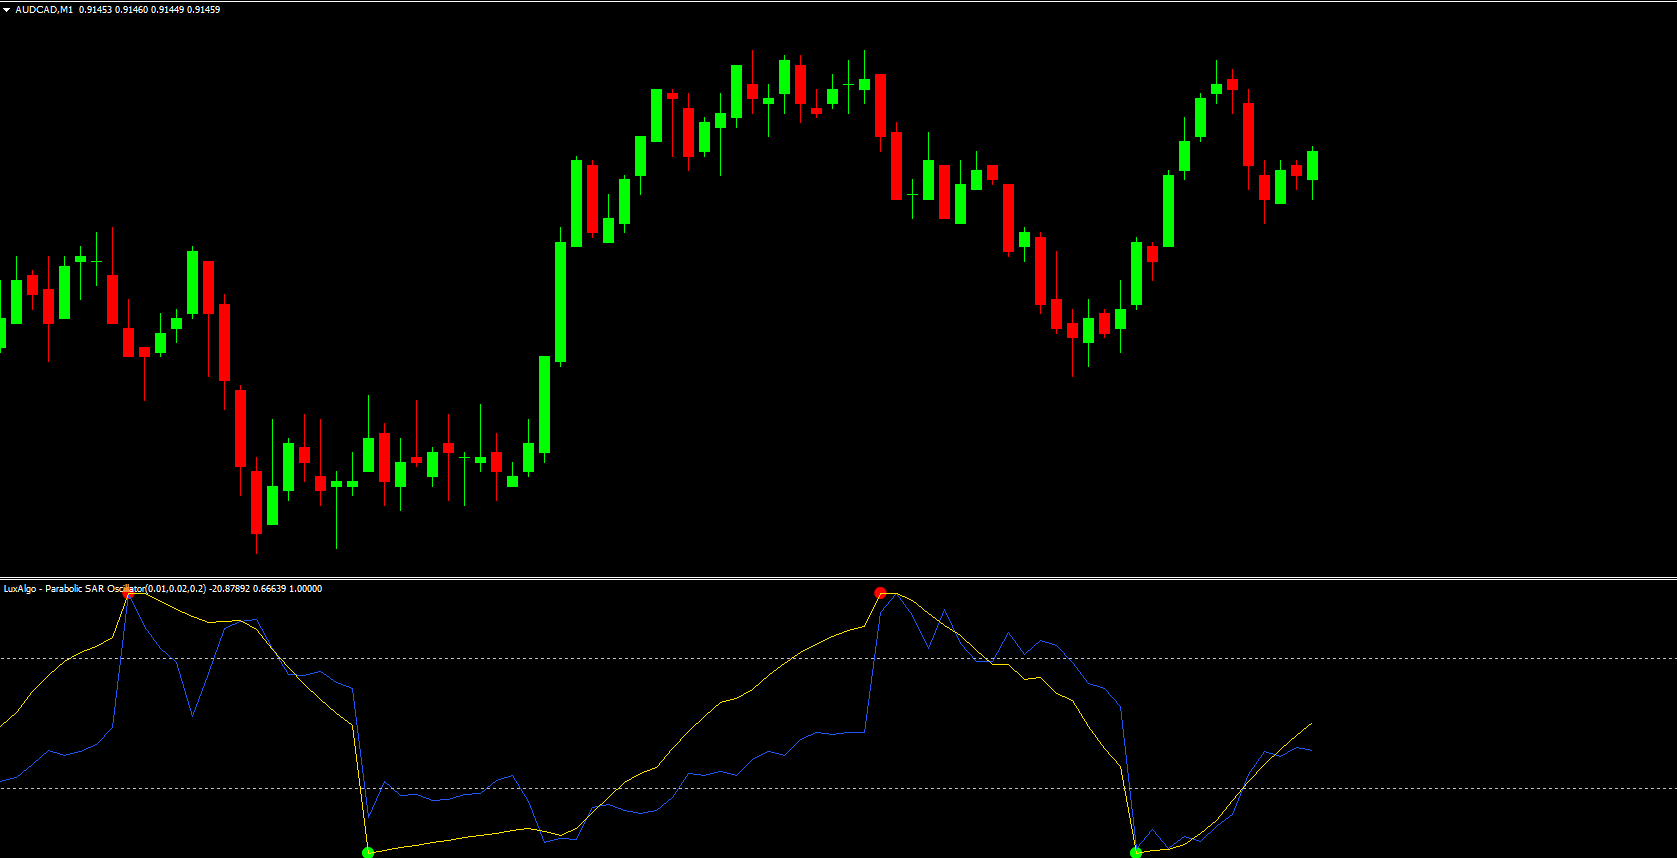
While the standard Parabolic SAR places dots directly on the price chart to indicate trend direction, the Parabolic SAR Oscillator moves the data into a subwindow and represents it as a continuous curve. This transformation helps traders identify trend shifts earlier and with greater precision, especially in volatile or trending markets.
By highlighting overbought and oversold zones, the indicator makes it easier to spot exhaustion points, time entries and exits, and anticipate reversals before the traditional SAR dots flip.
How the Parabolic SAR Oscillator Works
The Parabolic SAR Oscillator by LuxAlgo plots an oscillating curve that reflects the SAR’s momentum relative to market price. Its smooth motion makes short-term fluctuations easier to interpret, reducing chart noise.
The oscillator line travels between defined upper and lower boundaries that represent potential overbought and oversold regions. These areas help traders identify when momentum is waning or when a trend may be preparing to reverse direction.
Parabolic SAR Oscillator Trading Signals
The indicator generates actionable trading signals through visual cues and curve dynamics:
Green Circles (Bottom of Oscillator): Indicate oversold conditions and potential bullish reversals. This is where traders might look for long opportunities.
Red Circles (Top of Oscillator): Indicate overbought zones and potential bearish reversals, signaling a good time to take profits or consider short positions.
Sharp Rise from Lower Boundary: Suggests building bullish momentum and possible Trend Continuation.
Steep Drop from Upper Region: Suggests weakening momentum or the start of a bearish trend.
Confirming Signals
To improve accuracy, traders often combine the Parabolic SAR Oscillator with other tools such as:
Volume-based indicators (like On-Balance Volume or Volume Profile) for momentum confirmation.
Price structure tools (support/resistance levels or Fibonacci retracements).
Moving averages for trend direction alignment.
This layered approach strengthens the reliability of signals and minimizes false entries.
Key Features and Benefits
Smooth Oscillator Format: Provides a cleaner, more fluid reading of market dynamics compared to traditional SAR dots.
Overbought/Oversold Zones: Highlights exhaustion areas for early reversal detection.
Color-Coded Alerts: Red and green markers visually indicate key turning points.
Early Momentum Detection: Offers earlier signals than standard Parabolic SAR indicators.
Ideal for Trend Traders: Works well in both volatile and trending conditions.
Customizable Parameters: Users can adjust sensitivity and levels to suit their trading style.
Why Use the Parabolic SAR Oscillator for MT4?
The Parabolic SAR Oscillator for MT4 is ideal for traders who want to refine their timing and enhance the precision of their entries and exits. Its smooth dynamics make it especially useful for identifying exhaustion phases before the market shifts direction.
By combining the benefits of a trend-following system with the visual clarity of an oscillator, this indicator serves as a versatile tool for both reversal traders and momentum strategists.
Whether used independently or alongside other LuxAlgo tools, it provides traders with real-time insight into the strength and sustainability of price trends.
Conclusion
The Parabolic SAR Oscillator by LuxAlgo is a creative and effective evolution of the classic Parabolic SAR model. It brings greater clarity, smoothness, and timing precision to trend analysis, making it a valuable asset for traders navigating volatile markets.
By pinpointing overbought and oversold conditions before traditional SAR reversals occur, the indicator gives proactive traders a clear edge in anticipating trend shifts.
Download the Parabolic SAR Oscillator for MT4 today from IndicatorForest.com and experience smoother, smarter trend detection for your trading strategy.
FAQ
17 Downloads
Published:
Nov 06, 2025 14:18 PM
Category: