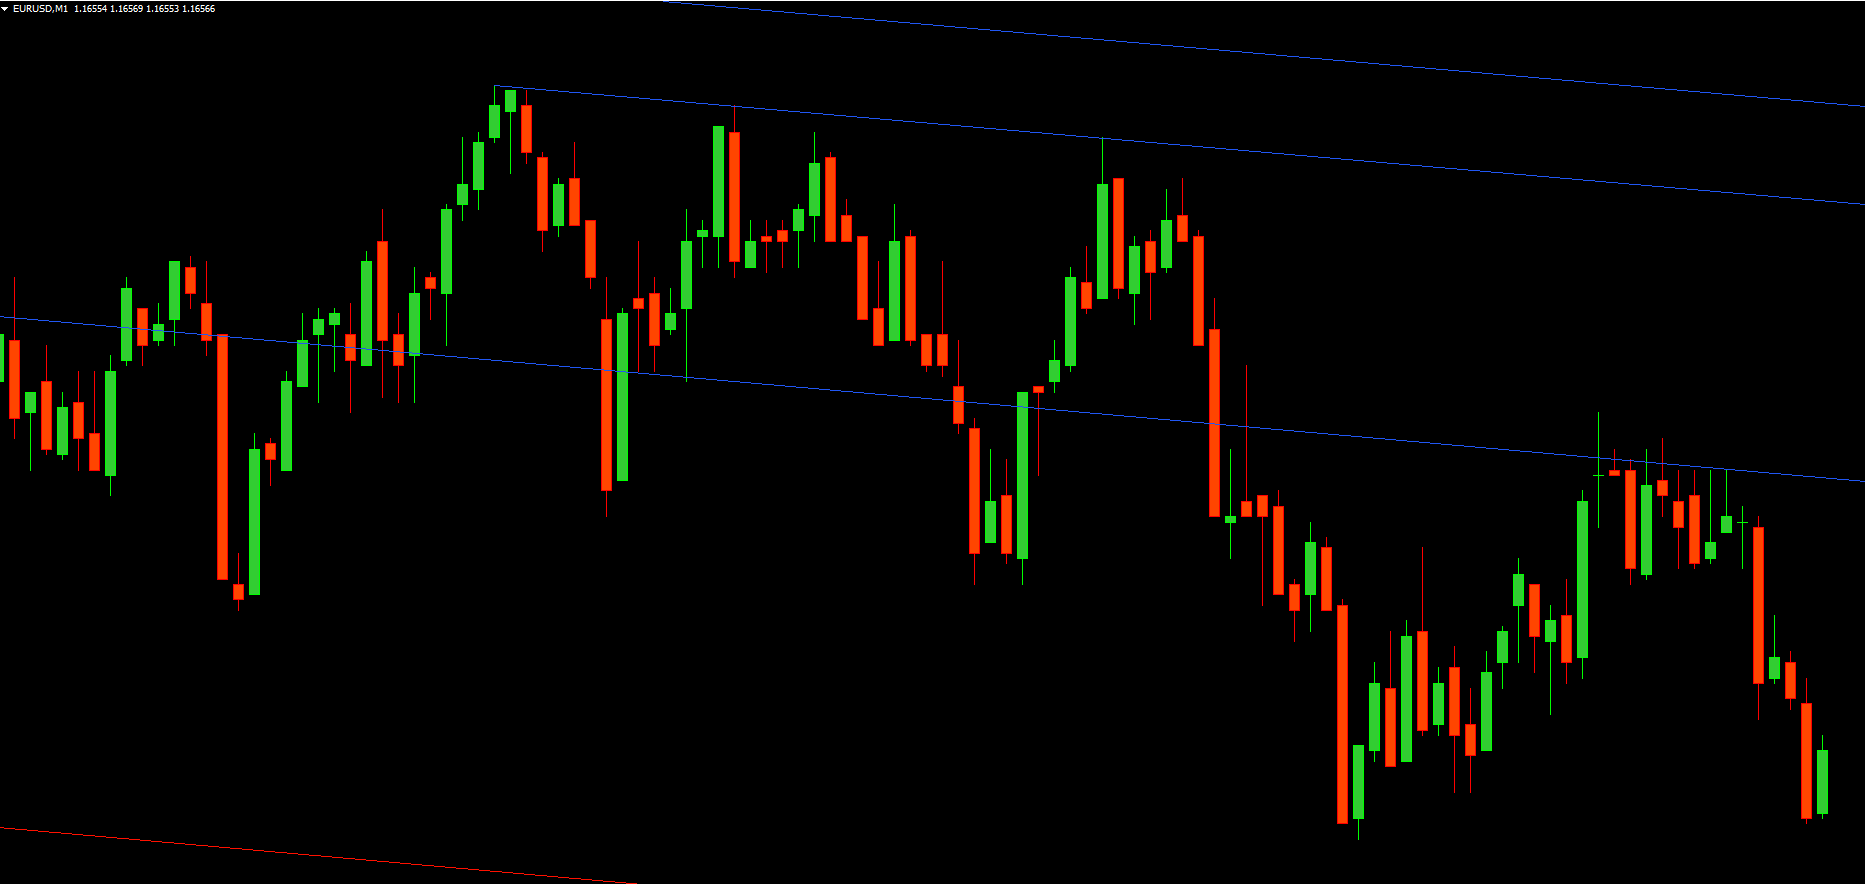
The Parallel Pivot Lines Indicator by LuxAlgo is a powerful trading tool designed to identify dynamic Support And Resistance levels using a price channel framework. Unlike traditional pivot points that remain static, this indicator constructs parallel price channels that evolve with market movement, allowing traders to visualize structure in real time.
Whether you’re a day trader, swing trader, or long-term investor, the Parallel Pivot Lines Indicator adapts to your strategy by highlighting zones where price is likely to react — enabling smarter, faster decisions.
How the Indicator Works
At its core, the indicator leverages recent price highs and lows to calculate a central pivot slope. It then projects parallel lines on either side of this slope to form a dynamic channel. As price moves, these channels adjust automatically, maintaining alignment with market trends.
This automated structure eliminates the need to manually draw trendlines and ensures your analysis remains consistent and objective. Traders often use the indicator alongside tools like moving averages, RSI, or volume profiles to confirm trade setups.
Identifying Support and Resistance
The Parallel Pivot Lines Indicator provides clear insight into where price is finding support or facing resistance within a trend. When the market approaches a pivot low line, it often suggests a potential bounce zone, while proximity to a pivot high line can indicate selling pressure or overbought conditions.
Repeated bounces near the lower channel may indicate bullish momentum, whereas multiple touches of the upper channel might signal a weakening uptrend or potential reversal.
Trading Breakouts and Continuations
One of the most effective ways to use this indicator is during breakout conditions. When price breaks above or below the channel with strong momentum, it often confirms trend continuation or acceleration. This is especially useful for traders following momentum-based strategies or trend-following systems.
For instance, a breakout above the upper pivot channel during high volume can signal strong buyer interest — providing an opportunity for entry confirmation.
Benefits of Using the Parallel Pivot Lines Indicator
The Parallel Pivot Lines Indicator by LuxAlgo offers several advantages for technical traders:
Real-time adaptability: Automatically adjusts to changing Market Structure.
Clarity and simplicity: Removes subjective manual drawing of trendlines.
Versatility: Suitable for all timeframes and market types (forex, crypto, stocks).
Precision: Uses mathematical slope alignment and pivot logic for accuracy.
Customizable: Adjust slope sensitivity, color themes, and channel width to fit your strategy.
These features make it an ideal addition for traders seeking structured, visually intuitive technical analysis.
Example Trading Approach
A common approach involves waiting for the price to retest the lower channel line in an uptrend and enter long positions once a bullish confirmation candle forms. Conversely, traders may look for short setups when price rejects the upper channel in a downtrend.
Combining the indicator with a momentum oscillator (like RSI) or volume confirmation increases the reliability of these signals.
The Parallel Pivot Lines Indicator by LuxAlgo enhances your ability to interpret market structure with clarity and precision. It’s especially useful in fast-moving markets, where quick and confident decisions are essential.
By simplifying trend visualization, this tool bridges the gap between traditional pivot indicators and advanced channel-based systems — helping traders identify optimal entry and exit zones.
Conclusion and Next Steps
In summary, the Parallel Pivot Lines Indicator by LuxAlgo delivers a modern, data-driven approach to dynamic market analysis. It helps traders anticipate reactions around pivot levels and adapt to evolving price behavior without constant redrawing.
If you’re looking to enhance your charting setup, explore this indicator and many more advanced tools at IndicatorForest.com — your destination for premium trading indicators and strategy resources.
FAQ
2 Downloads
Published:
Dec 10, 2025 10:27 AM
Category: