Master the Markets with the Pivots Multi Times Indicator for MT4
In the world of day trading, pivot points are often considered the "secret sauce" used by institutional traders to identify key levels of Support And Resistance. However, manually calculating these levels across different timeframes can be exhausting and prone to error. The Pivots Multi Times indicator for MetaTrader 4 automates this process, providing a comprehensive view of Market Structure directly on your chart.
Why Multi-Timeframe Pivots Matter
Standard pivot point indicators only show levels for the current timeframe. The strength of Pivots Multi Times lies in its ability to overlay higher-timeframe data—such as daily, weekly, or monthly pivots—onto a lower-timeframe chart like the M1. This gives traders a "macro" perspective while they hunt for "micro" entries.
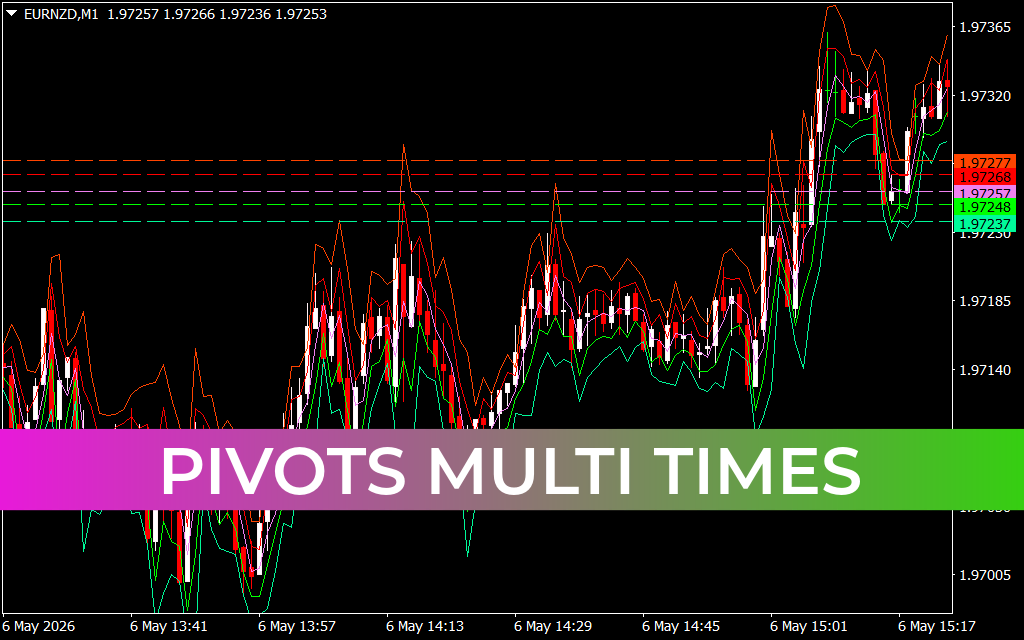
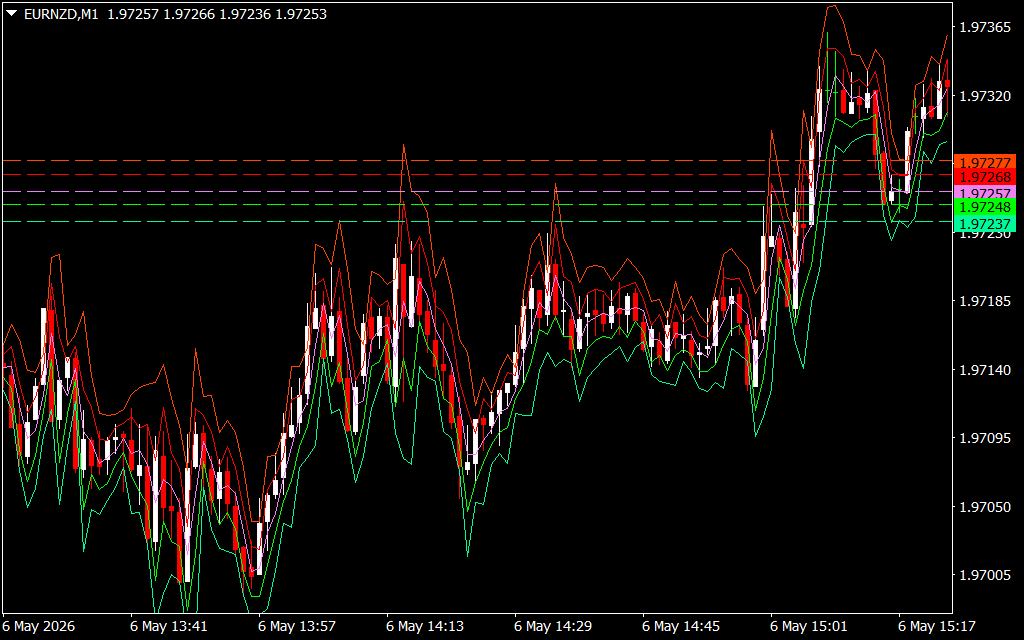
When a currency pair like the EURNZD approaches a pivot level, it often reacts. As seen in the market data from EURNZDM1.png, these levels act as psychological barriers where price tends to stall, reverse, or break through with significant momentum.
Key Features of Pivots Multi Times
- Multi-Layered Support and Resistance: The indicator plots multiple levels (R1, R2, R3 and S1, S2, S3) based on mathematical formulas derived from previous Price Action.
- Dynamic Visual Levels: As demonstrated in EURNZDM1.png, the tool uses distinct color-coded horizontal lines—ranging from red and orange to green—to help traders instantly distinguish between major resistance and support zones.
- Contextual Trend Envelopes: Beyond simple lines, the indicator often features channel-like envelopes that visualize price volatility and range, helping you stay on the right side of the trend.
- Real-Time Data Integration: The levels update automatically as new candles close, ensuring you are always trading with the most current institutional data.
Trading Strategies with Pivots Multi Times
The most effective way to use this tool is to look for Confluence Zones. A confluence occurs when a daily pivot aligns perfectly with a weekly support level. These areas have a much higher probability of holding price.
In the chart EURNZDM1.png, notice how the price action interacts with the dashed horizontal lines. Smart traders use these as targets for take-profits or as "line-in-the-sand" markers for stop-losses. If the price breaks a resistance level and stays above it, that level often flips to become support, offering a classic "break and retest" entry opportunity.
Conclusion
The Pivots Multi Times indicator is an essential asset for any MT4 trader looking to simplify their technical analysis. By bringing institutional-grade support and resistance levels to your desktop, it removes the guesswork from your strategy. Whether you are a scalper looking for quick bounces or a swing trader targeting major weekly moves, this tool provides the clarity needed to navigate the Forex market with professional-grade precision.er free Forex tools for MT4.
1 Download
Last Update:
May 06, 2026 20:29 PM
Published:
Jan 27, 2026 01:51 AM
Category: