Quantifying Market Efficiency: The Polarized Fractal Efficiency (PFE) Indicator
Financial markets constantly cycle between two primary structural states: highly efficient, directional trends and inefficient, chaotic consolidations. For traders, entering a market that lacks clean efficiency frequently leads to chopped accounts and stagnant capital. The Polarized Fractal Efficiency (PFE) Indicator applies advanced fractal geometry to Price Action, determining how efficiently an asset is moving from point A to point B. By measuring this mathematical efficiency, the tool allows traders to spot mature trends ripe for a reversal and identify new ones just beginning to accelerate.
Here is an in-depth breakdown of how this unique oscillator functions and how to utilize it to optimize your trading terminal.
The Mathematics of Fractal Efficiency
Developed by Hans Hannula, the PFE indicator is rooted in the concept that the shortest distance between two points is a straight line. When a market is in an extremely strong, institutional trend, price action moves efficiently, resembling a straight line. Conversely, when the market is fluctuating in a choppy range, the path becomes jagged and inefficient.
The PFE algorithm calculates the ratio of the straight-line distance between the current price and a historical price point (determined by the period setting, such as PFE(5)) against the actual, cumulative distance price traveled to get there. It then plots this value as a bounded line oscillating between $+1.00$ and $-1.00$ (or $+100$ and $-100$ depending on terminal scaling).
Decoding the Sub-Window Oscillations
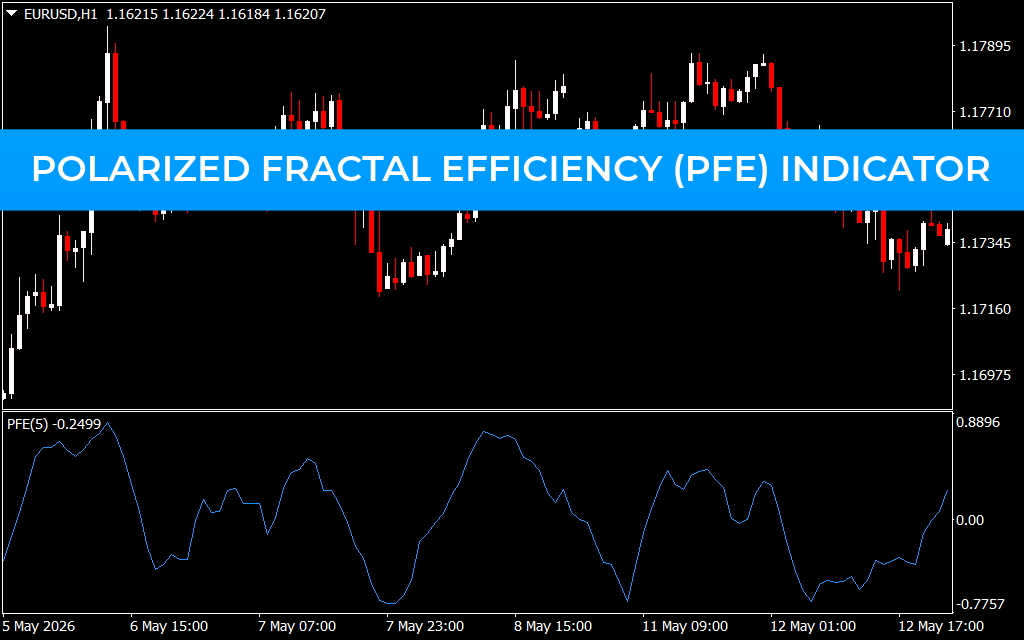
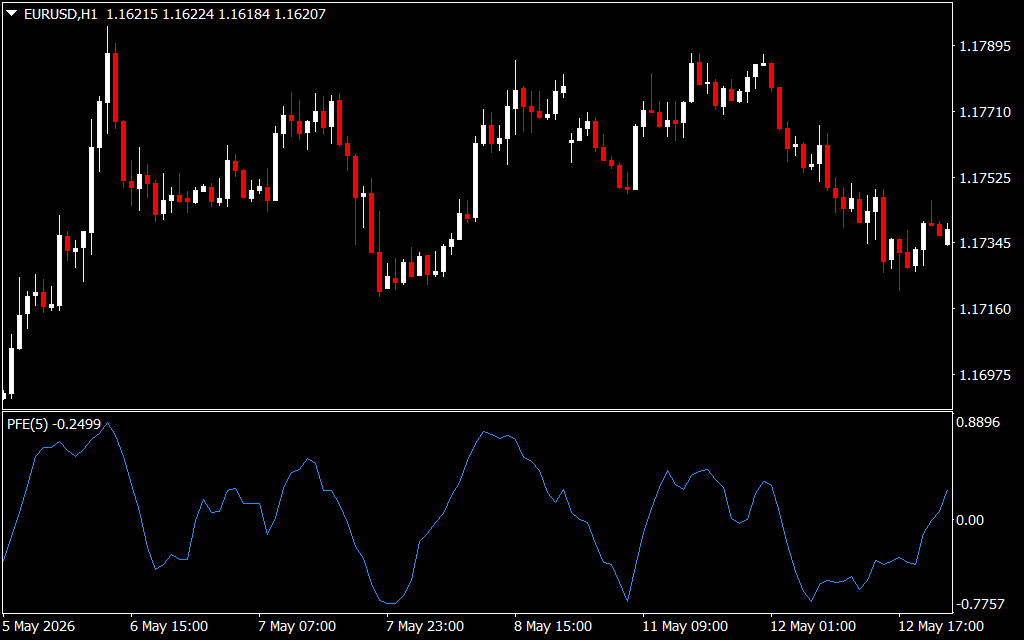
As displayed on the EUR/USD H1 chart, the PFE indicator operates cleanly in a dedicated sub-window below the price candles. The oscillator line provides real-time data based on three critical zones:
- The Zero-Line Equilibrium ($0.00$): The center axis represents a state of complete mathematical inefficiency or balance. When the PFE line crosses above zero, it signals that the bulls are gaining efficient control. When it drops below zero, the bears are driving price efficiently downward.
- The Upper Bound (Extreme Efficiency / Overbought): When the PFE line surges toward the upper extreme (near $+0.88$ on the chart), it confirms a highly efficient bull run. However, when it hooks downward from this peak, it warns that the trend has exhausted its structural efficiency and a corrective pullback or reversal is imminent.
- The Lower Bound (Extreme Efficiency / Oversold): When the line drops toward the lower extreme (near $-0.77$), a highly efficient liquidation is underway. A sharp hook upward from this zone suggests selling pressure is spent, alerting traders to lock in short profits or look for long entries.
Strategic Application for Swing Trading
To build an edge with the Polarized Fractal Efficiency indicator, employ these professional rules:
- Trend Inception Execution: Look for instances where the PFE line moves from a compressed state near zero and aggressively crosses the $0.00$ line. A sharp, steep angle crossing zero confirms that a fresh, highly efficient trend is expanding out of a consolidation zone.
- Divergence Squeezes: Watch for moments where price action makes a lower structural low on the chart, but the PFE line prints a higher low within its lower bound. This mathematical divergence reveals that while price is falling, the underlying efficiency of the sellers is dying out, setting up a sharp upward spike.
- Filtering Trend Fragility: Avoid buying an asset when the PFE line is already flatlining at the absolute upper extreme. This signals a mature trend where the risk-to-reward ratio for new buyers is highly unfavorable.
2 Downloads
Last Update:
May 17, 2026 01:54 AM
Published:
Jan 20, 2026 22:59 PM
Category: