Maximize Trading Clarity with the Price Positions Indicator
Navigating the financial markets requires a flawless understanding of Market Structure and real-time data execution. Retail traders often lose money not because their thesis is wrong, but because they mistime entries or lose track of critical market levels amidst a sea of moving candles. The Price Positions indicator for MetaTrader provides a comprehensive solution, combining algorithmic structural mapping with clear, on-screen text overlays to guide your daily execution.
Here is an in-depth breakdown of how this technical layout indicator streamlines your market analysis and boosts your trading confidence.
What is the Price Positions Indicator?
The Price Positions indicator is a specialized technical tool that acts as an all-in-one market cockpit. It continuously runs calculations on market highs and lows while monitoring localized price data. The indicator presents this analysis in two distinct visual layers directly on your primary trading chart:
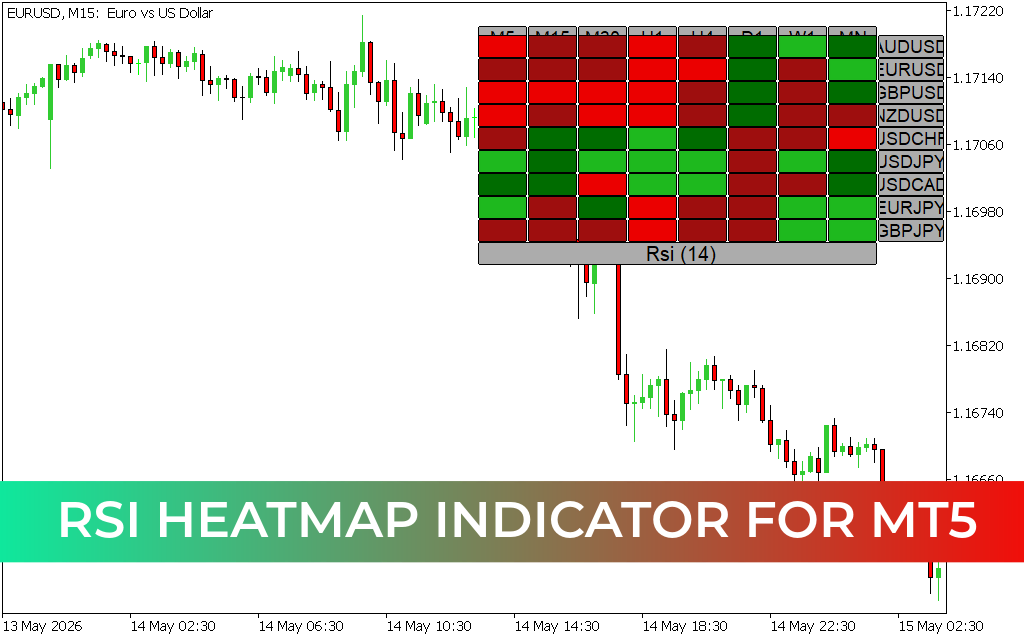
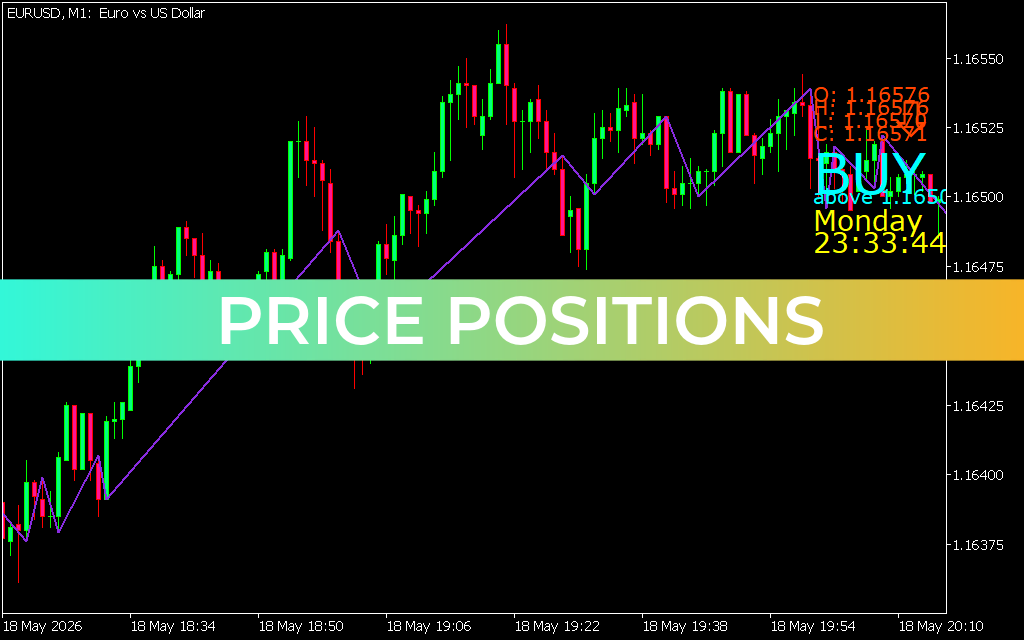
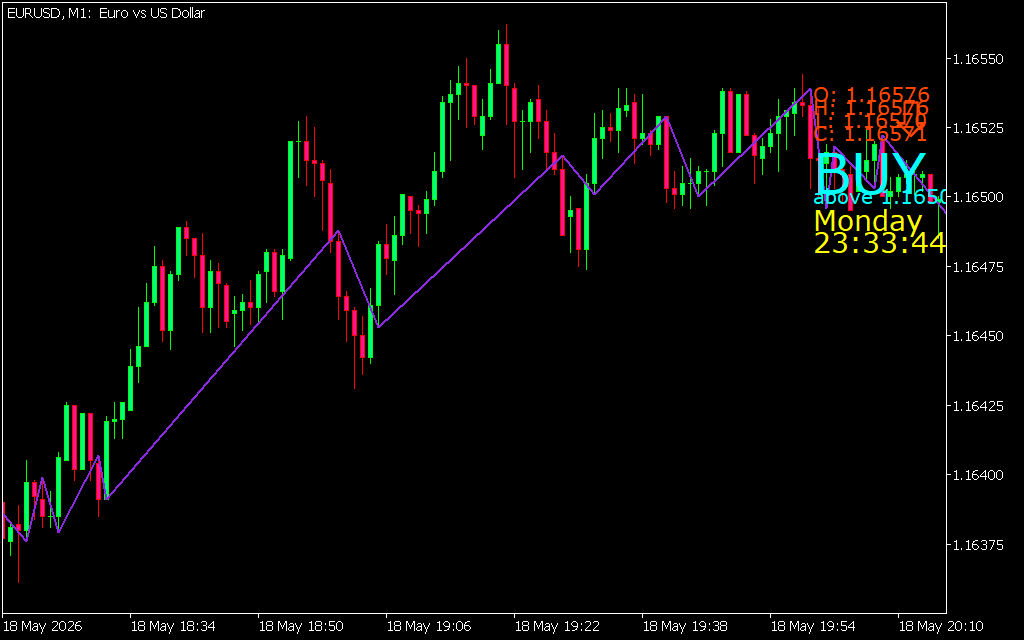
- ZigZag Market Structure: The purple line traces the core swings of the market, cleanly connecting structural highs and lows. This helps traders filter out minor price noise and immediately spot whether the market is making higher highs or lower lows.
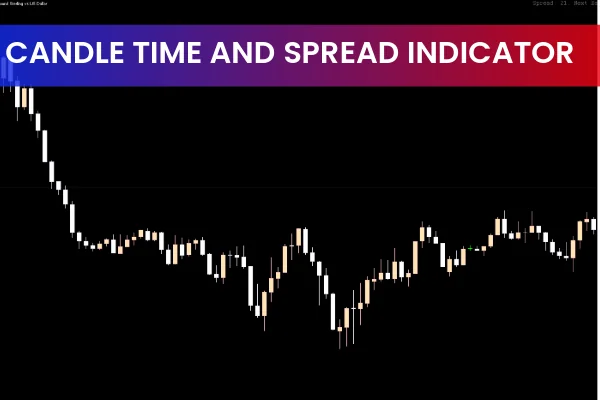
- Real-Time Data Dashboard: On the right-hand side of the screen, the indicator overlays essential technical readouts. This includes precise Open, High, Low, and Close (OHLC) details for the active candle, a bold directional bias trigger (such as the bright cyan "BUY" alert), and a localized broker clock showing the exact day and time.
As demonstrated on the EURUSD M1 chart, the indicator perfectly syncs structural swing lows with major directional text hints, telling you exactly when and where to look for an entry.
Primary Benefits for Fast-Paced Traders
- Eliminate Analytical Blindspots: Having the OHLC metrics and broker time displayed in massive font ensures you never miscalculate a candle close or enter a position during low-liquidity market rollovers.
- Instant Market Bias Detection: The explicit text indicators (like "BUY above 1.1650") give retail traders rapid confirmation of institutional bias, reducing hesitation during volatile market openings.
- Automated Swing Analysis: By letting the purple structural lines track the market matrix, you can easily map out support, resistance, and Fibonacci retracement zones without manual guesswork.
Strategic Application and Trading Rules
To trade efficiently using the Price Positions indicator, pair the structural swing lines with the dashboard triggers:
- The Structural Breakout Entry: Watch the purple swing lines to identify major structural peaks. If the dashboard prints a "BUY" signal and the price breaks cleanly above the most recent peak plotted by the line, it confirms a high-probability bullish breakout.
- The Level-Defense Play: Use the exact numeric price boundaries provided by the dashboard text (e.g., "above 1.1650") as your baseline for defense. If the price holds above this specified level during a structural pullback, it acts as an ideal location to scale into a trend-continuation position with minimal risk.
1 Download
Last Update:
May 19, 2026 01:35 AM
Published:
Jan 19, 2026 20:53 PM
Category: