Unlocking Multi-Asset Momentum: A Guide to the RSI Heatmap Indicator for MT5
In modern financial markets, trading a single currency pair in isolation is a recipe for missed opportunities and hidden risks. Currencies are fundamentally interconnected, and a strong move in the US Dollar can ripple across the entire Forex landscape simultaneously. For MetaTrader 5 (MT5) traders looking to master this cross-asset dynamic, the RSI Heatmap indicator serves as a vital dashboard, condensing complex multi-pair and multi-timeframe structural data into a single, highly intuitive visual matrix.
What is the RSI Heatmap Indicator?
The Relative Strength Index (RSI) is globally recognized as an exceptional tool for measuring overbought and oversold market conditions. However, tracking individual RSI lines across dozens of charts is mathematically exhausting. The RSI Heatmap indicator solves this layout challenge by gathering multiple assets and timeframes into an organized grid overlay on your main workspace.
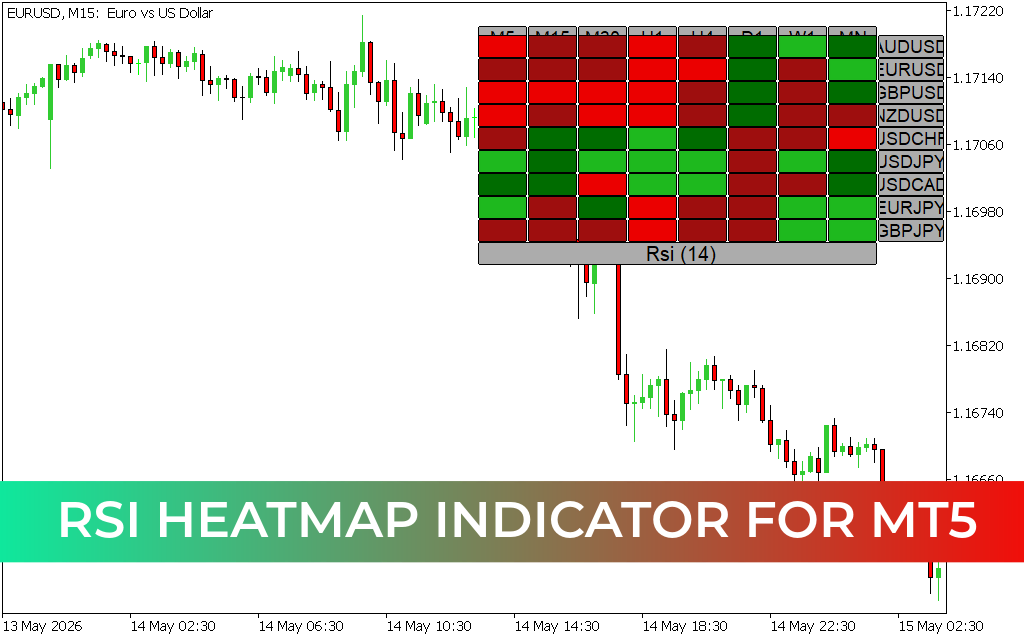
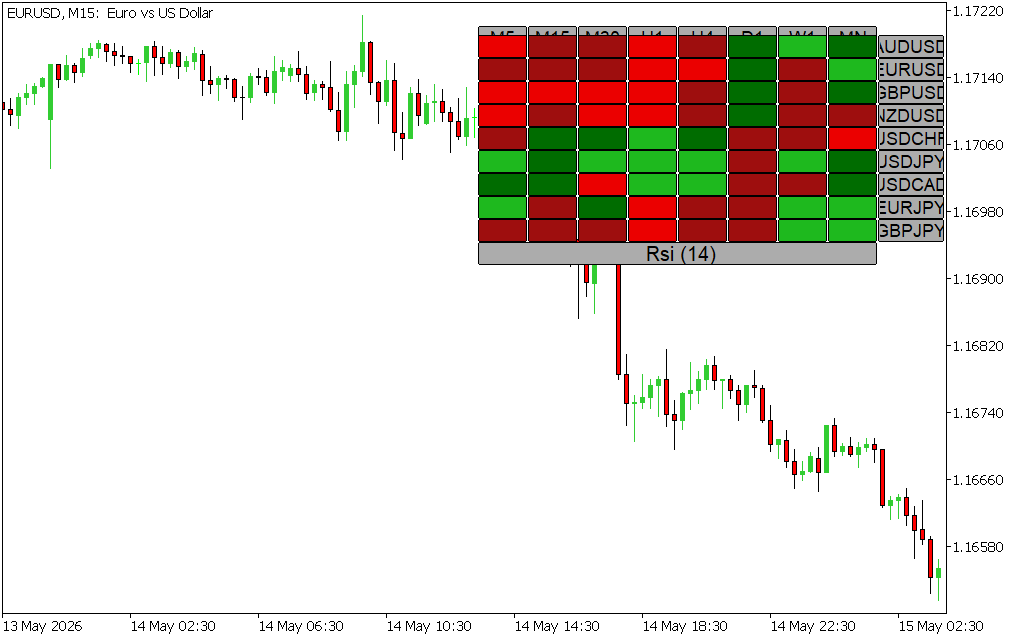
As displayed on the EURUSD M15 chart, the indicator tracks a vast catalog of major pairs (such as AUDUSD, EURUSD, GBPUSD, and USDJPY) across standard algorithmic timeframes—ranging from the 5-minute (M5) scale all the way up to the Monthly (MN) chart. It presents this data using a clear, color-coded momentum matrix:
- Bright Green Blocks: Indicate extreme bullish momentum, showing assets where the RSI has broken into strong overbought or high-velocity expansion territory.
- Dark Green Blocks: Signal a moderate upward bias or building bullish structural alignment.
- Bright Red Blocks: Represent intense bearish velocity, highlighting heavily oversold conditions or aggressive selloffs.
- Dark Red/Maroon Blocks: Signal a moderate downward bias or steady institutional distribution.
High-Probability Trading Strategies with the RSI Heatmap
The matrix-style structure of the RSI Heatmap for MT5 unlocks several professional execution models:
- Multi-Timeframe Trend Confluence: The highest-probability setups occur when an asset aligns across every major interval. For instance, if you look at the EURUSD row on the M15 chart, the simultaneous block of dark and bright red across the lower timeframes confirms a structural intraday selloff, warning you to avoid dangerous counter-trend buying.
- Spotting Market-Wide Correlation Breakouts: By scanning vertically down a specific timeframe column (like H1), you can gauge broader market sentiment. If every major pair against the US Dollar turns green at the same moment, it signals a massive, market-wide institutional wave of USD weakness, allowing you to choose the absolute strongest pair to trade.
- Mean-Reversion Tracking: When the indicator blocks flash bright green or bright red across multiple consecutive boxes, it serves as an instant alert that the asset is severely overextended across multiple layers of structure, tipping you off to imminent profit-taking and technical pullbacks.
Built for the Advanced MT5 Dashboard Environment
Processing dozens of historical mathematical calculations across multiple pairs and intervals simultaneously would crash older trading software. The RSI Heatmap indicator is optimized specifically for MetaTrader 5's multi-threaded core. It smoothly handles real-time cross-asset data delivery without lagging your terminal execution, making it the perfect master panel for professional day traders and portfolio managers alike.
Conclusion
The RSI Heatmap indicator for MT5 upgrades a classic oscillator into a multi-asset intelligence center. By transforming dense chart data into an easy-to-read, actionable color matrix, it ensures you always trade with a clear understanding of global market momentum.
2 Downloads
Last Update:
May 16, 2026 03:14 AM
Published:
Jan 21, 2026 13:57 PM
Category: