The Professional Swing Indicator is a popular and free Forex tool for the MetaTrader 4 (MT4) platform. It is designed to help traders identify trends and generate clear buy and sell signals using colored bars and dots on the chart. This visual approach simplifies trade decisions, making it easier for traders to time entries and exits.
By integrating the Professional Swing Indicator into your trading strategy, you can enhance trend analysis, detect potential reversals, and improve overall trading performance.
How the Professional Swing Indicator Works
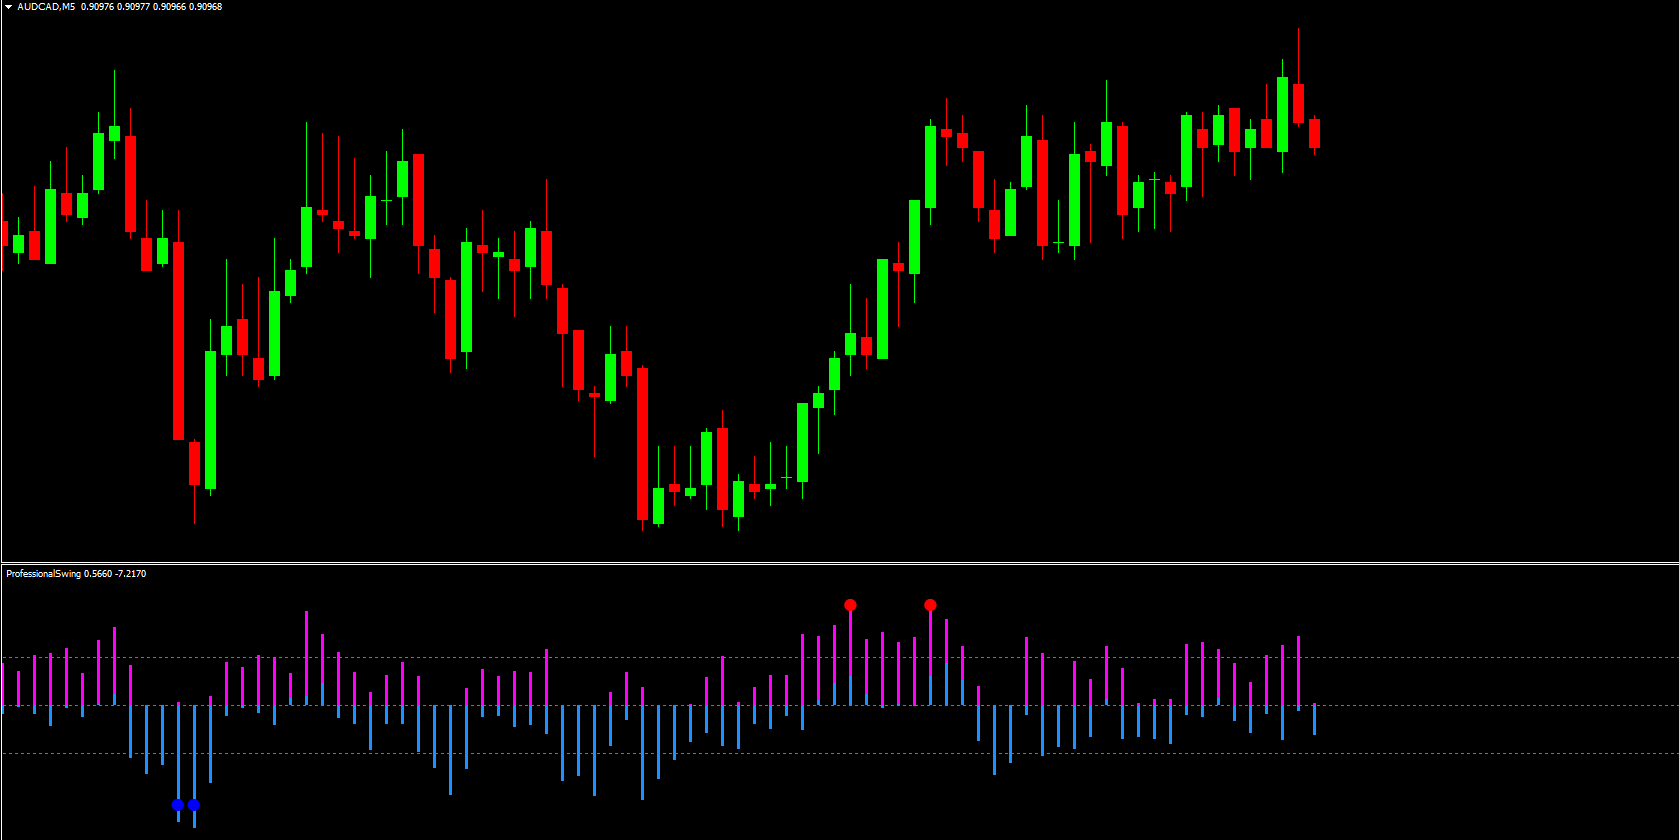
The indicator works by plotting colored bars and dots on the MT4 chart:
Purple bars: Appear above the zero line, signaling a strong uptrend, especially when above the 12-line
Blue bars: Appear below the zero line, indicating a downtrend
Red dots: Indicate buy signals and mark potential market lows
Blue dots: Indicate sell signals and mark potential market highs
These visual cues allow traders to quickly identify the trend direction, possible entry points, and exit points in the market.
Key Features of the Professional Swing Indicator
The Professional Swing Indicator includes several features that make it a useful MT4 tool:
Displays buy and sell signals with colored bars (purple for uptrend, blue for downtrend)
Marks market highs and lows with red and blue dots
Utilizes the 12-line to measure Trend Strength
Provides clear entry and exit points for trades
Works on multiple timeframes, with higher timeframes providing more reliable signals
Can be combined with other indicators like MACD or RSI for confirmation
Free and easy to install on MT4
These features make it easier for traders to identify trends, follow market swings, and manage risk effectively.
Benefits of Using the Professional Swing Indicator
The Professional Swing Indicator offers several advantages for Forex traders:
Provides clear buy and sell signals for timely trade execution
Highlights trend direction and strength using colored bars and the 12-line
Marks high and low points on the chart to plan entries and exits
Helps traders identify Trend Continuation and avoid premature exits
Works across multiple timeframes, offering flexibility for Scalping, day trading, and swing trading
By using this indicator, traders can increase accuracy in their trading decisions and improve profitability.
How Traders Can Use the Professional Swing Indicator Effectively
To use the Professional Swing Indicator effectively:
Enter long positions when purple bars appear above the 12-line and red dots mark market lows
Enter short positions when blue bars appear below the 12-line and blue dots mark market highs
Exit trades when the corresponding dot appears against your position
Combine the indicator with MACD or RSI for additional confirmation of trend strength
Focus on higher timeframes for more reliable signals while using lower timeframes for refinement
This method allows traders to capitalize on market swings while minimizing exposure to false signals.
Why the Professional Swing Indicator Is Popular
The Professional Swing Indicator is widely used because it provides clear visual signals for market trends, entry, and exit points. Its combination of colored bars and dots allows traders to track swings in the market efficiently, making it a valuable tool for both beginners and advanced Forex traders.
Overall, the Professional Swing Indicator is a powerful MT4 tool that can help traders identify trends, trade swings, and improve overall trading performance.
Download the Professional Swing Indicator today from IndicatorForest.com and enhance your Forex trading strategy with reliable entry and exit signals.
FAQ
This swing indicator aims to capture short‑term swings in price by marking likely buy and sell zones as well as potential reversals. It is intended for traders who want to take advantage of moves within the broader trend.
Consider buying when it highlights a swing low in an uptrend and selling when it flags a swing high in a downtrend, especially if other tools agree. Exiting at opposite signals can help lock in profits.
It is generally most effective on intraday and H4 charts where swings are well‑defined. Very low timeframes can be too noisy, while very high timeframes may produce too few setups for active traders.
RSI, MACD, moving averages and key horizontal levels are commonly used to confirm that a detected swing aligns with momentum and structure. This reduces the chance of trading minor corrections against strong trends.
Yes, it can help newer traders see how markets move in waves, but they should avoid over‑trading every minor swing and continue to apply solid risk‑management rules.
1 Download
Published:
Dec 18, 2025 02:12 AM
Category: