Maximizing Account Growth: Managing Risk on the EUR/USD M30 Chart
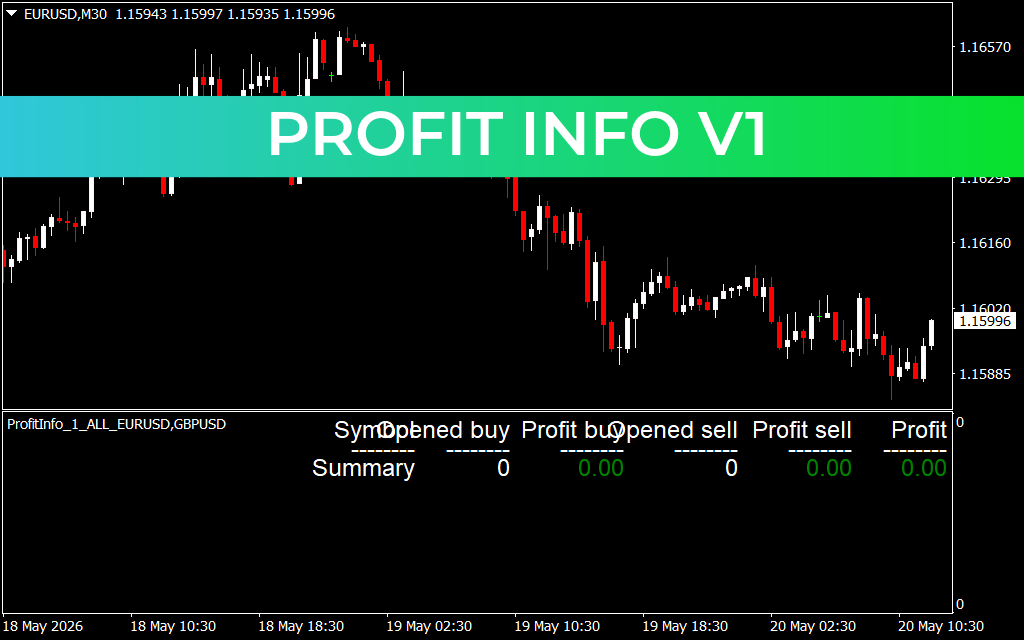
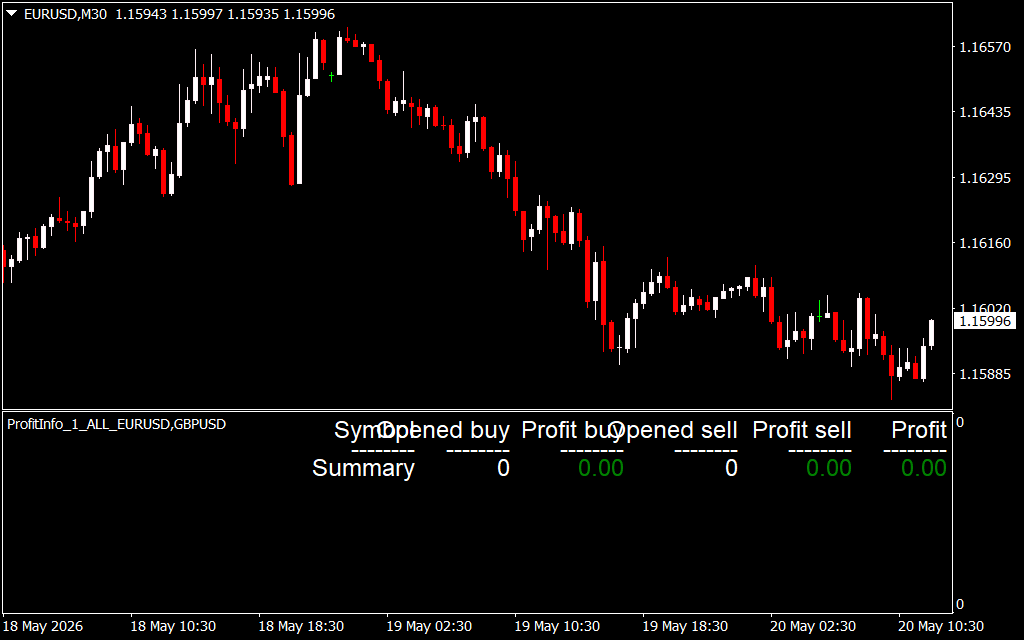
Trading highly liquid currency pairs like the EUR/USD on lower timeframes demands sharp operational oversight. On this 30-minute (M30) chart, we witness an aggressive market markdown spanning from May 18th to May 20th. Price cleanly distributed from the 1.16570 peak, tumbling through an institutional order flow sequence before finding a structural floor near the 1.15885 liquidity pool.
While identifying this downward trajectory is straightforward, managing open positions across multiple currency pairs simultaneously introduces immense psychological pressure and operational friction. A trader can quickly lose track of cumulative risk when scaling into multiple buy or sell positions across highly correlated pairs like the EUR/USD and GBP/USD. To sustain long-term account growth, keeping an unflinching eye on real-time net exposure and floating equity is completely non-negotiable.
The Power of Real-Time Portfolio Tracking
The technical setup featured at the bottom of the chart highlights an indispensable solution for active day traders and scalpers: the Profit Info V1 panel indicator. Instead of forcing traders to constantly toggle between the default trading terminal window and active charts, this dashboard centralizes operational data directly within your primary viewing screen.
When managing high-velocity market environments, this custom utility delivers clear, actionable advantages:
- Correlated Asset Tracking: The script explicitly maps out positions for multiple critical pairs simultaneously, displaying structural metrics for targeted instruments like EUR/USD and GBP/USD.
- Separation of Order Types: It cleanly breaks down open metrics into "Opened Buy," "Profit Buy," "Opened Sell," and "Profit Sell." This granularity lets you see exactly which direction of your portfolio is performing or causing a drawdown.
- Instant Risk Summary: By aggregating all positions into a unified "Summary" line, it flashes your net floating profit or loss in real-time. This eliminates mental math errors during high-impact news releases or fast market extensions.
Having a clean visual breakdown of your real-time performance allows you to enforce strict risk parameters, lock in profits manually, or cut losing streaks before they threaten your account equity.
Upgrading Your MetaTrader Workflow
The difference between amateur and professional execution lies in operational efficiency. Attempting to track dozens of open lots across multiple windows inevitably leads to cognitive overload and execution delays. Utilizing an automated account manager panel ensures that your trading statistics are completely transparent and instantly visible. By integrating this advanced dashboard plugin into your daily technical analysis layout, you strip away the chaos of active portfolio management—giving you the clarity needed to execute trades with clinical precision and absolute confidence.
1 Download
Last Update:
May 20, 2026 15:38 PM
Published:
Jan 18, 2026 19:28 PM
Category: