Streamline Day Trading Levels with the Pulse Fibonacci Pivot Indicator
In intraday Forex trading, identifying objective Support And Resistance zones is the difference between a profitable session and a string of stop-outs. While many discretionary traders draw random lines on their screens based on subjective templates, professionals rely on math-driven horizontal levels. Daily pivot points combined with structural Fibonacci ratios provide unmatched precision for intraday turning points. The Pulse Fibonacci Pivot indicator automates this technical framework completely, projecting vital price milestones right onto your MetaTrader canvas.
By calculating institutional key zones at the start of each trading session, this indicator gives day traders and scalpers an unshakeable roadmap for the hours ahead.
The Precision of Automated Session Mapping
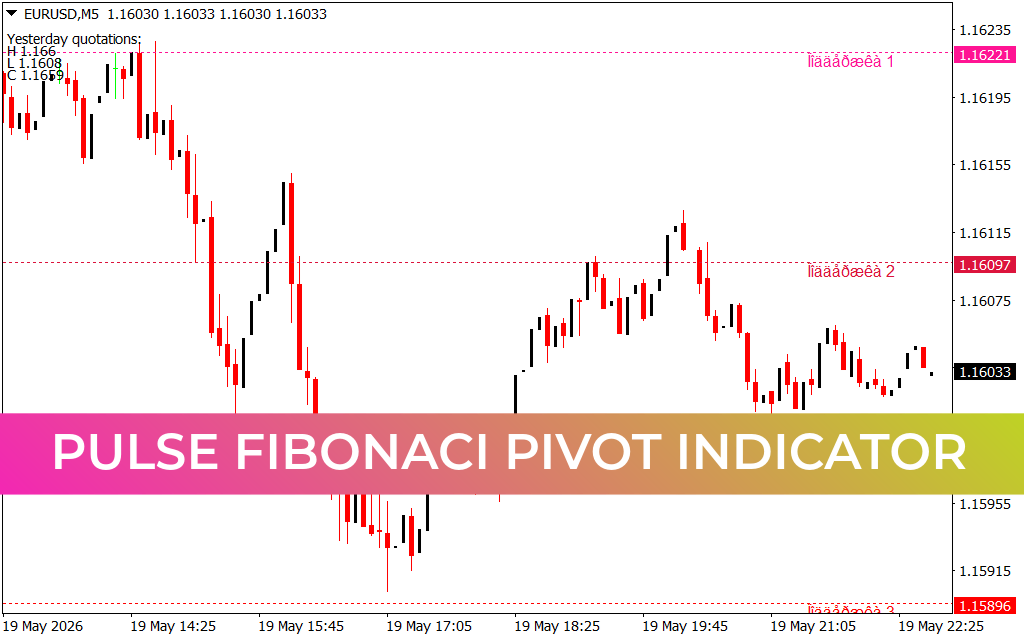
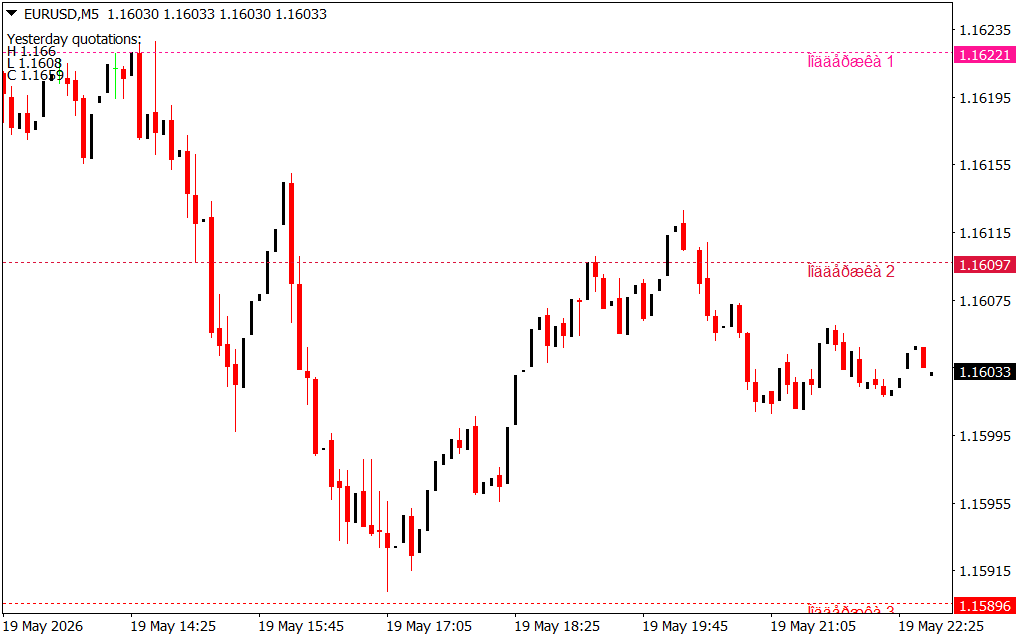
When analyzing rapid trends on a 5-minute ($M5$) chart, keeping track of major macro boundaries from the daily or weekly intervals is challenging. The Pulse Fibonacci Pivot utility bridges this gap by automatically gathering structural data from yesterday's quotations, including the exact high, low, and closing metrics.
As displayed on the EUR/USD chart under the Yesterday quotations matrix, the indicator prints clear, horizontal dotted lines across your workspace, categorized into definitive structural zones:
- Institutional Pivot Axis: The central median line serves as the anchor point for the active session. Trading above this baseline establishes an intraday bullish bias, while trading below it shifts focus strictly toward short positions.
- Fibonacci-Optimized Extensions: Unlike standard classic pivot tools, this version adapts key algorithmic Fibonacci ratios—such as the 38.2%, 50.0%, and 61.8% retracement scripts—to construct highly responsive expansion levels. These target areas indicate exactly where institutional profit-taking or aggressive trend reversals are likely to cluster.
Executing Low-Risk Strategy Around Daily Levels
Integrating automated session levels into your technical setup provides an objective edge when navigating short-term Market Structure.
1. Trading the Level Rejection (Continuation)
During a strong downward trending session, the market will frequently experience minor upward retracements. With the Pulse Fibonacci Pivot active, you can monitor these pullbacks as they approach an indicator-generated daily resistance boundary. When price tests the upper line and prints an exhaustion wick or a bearish engulfing candle, it confirms institutional distribution, offering a low-risk entry to ride the trend lower.
2. Spotting Exhaustion at Extreme Boundaries
The outermost horizontal lines plotted by the indicator represent extreme price extensions for the daily cycle. When an asset spikes into these outer bands during a low-volume session, it signals a highly overextended condition. Scalpers can utilize these areas to hunt for rapid counter-trend bounces as the market seeks equilibrium back toward the central pivot baseline.
Conclusion
The Pulse Fibonacci Pivot indicator removes human guesswork and manual calculation errors from your morning routine. By transforming historical session data into an actionable, forward-looking roadmap, it keeps you aligned with institutional order flow across any timeframe. Download the tool today to refine your technical layout and execute trades with structural confidence.
2 Downloads
Last Update:
May 20, 2026 01:46 AM
Published:
Jan 19, 2026 13:20 PM
Category: