Mastering High-Frequency Trends: Trading Volatility with the Qema Direction Indicator
In ultra-low timeframe environments like the 1-minute (M1) chart, day traders and scalpers battle a relentless wave of market noise. Liquid currency pairs, particularly the EUR/USD, are prone to sudden liquidity sweeps, micro-consolidations, and sharp, erratic price jumps. For retail traders using lagging trend tools, this high-frequency volatility presents a serious trap: entering a position too late right into trend exhaustion, or getting prematurely shaken out of a highly profitable run.
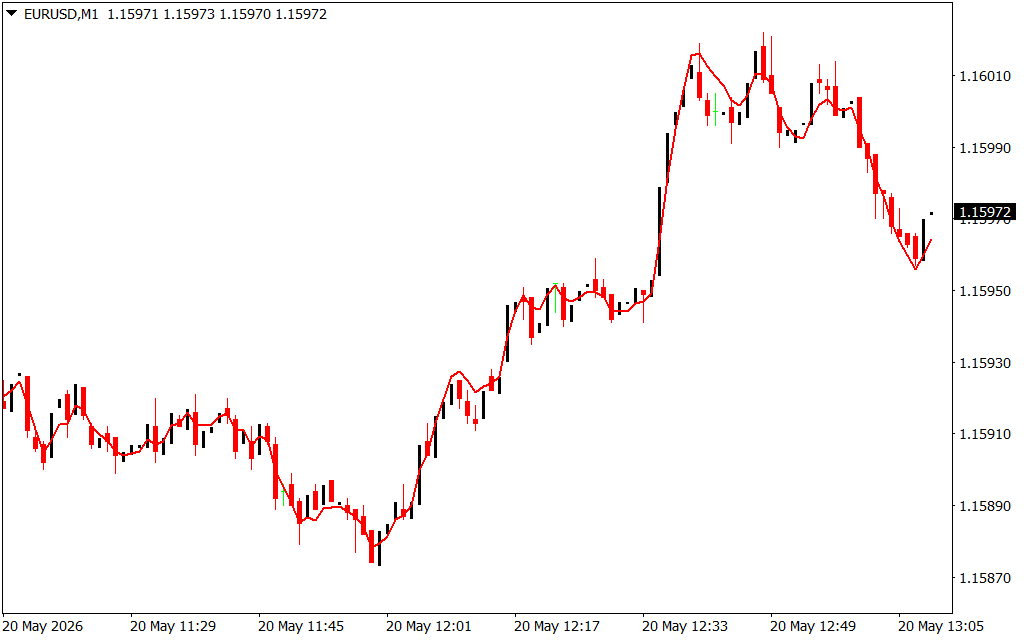
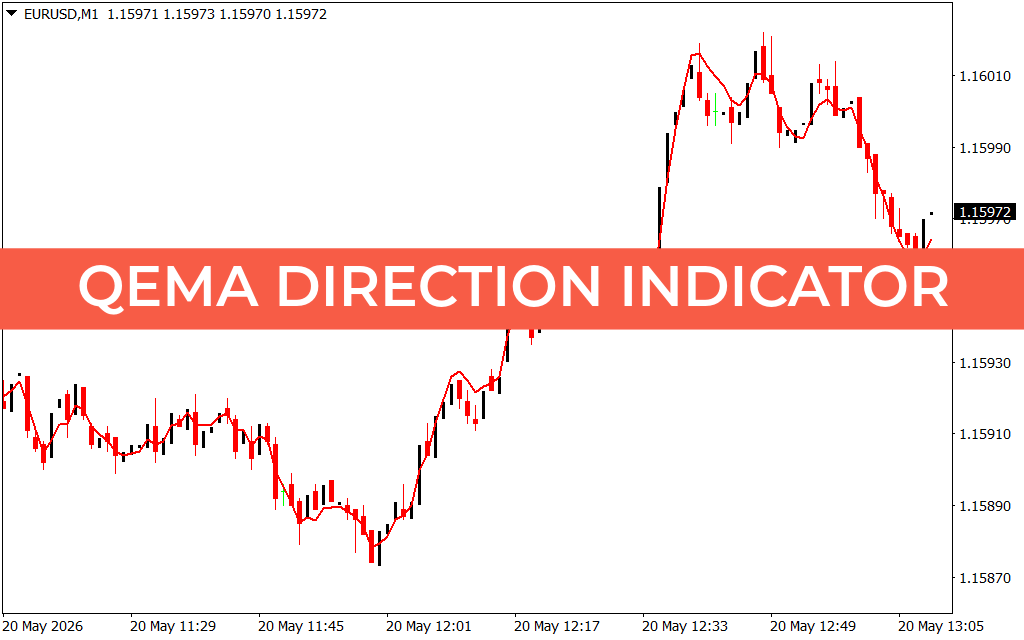
Looking closely at the EUR/USD M1 price delivery across the May 20th session, the market transitions through clear structural phases. The asset initially undergoes a choppy markdown phase, printing a series of lower highs and lower lows to sweep minor buy-side liquidity around 1.15870. Immediately following this exhaustive drop, massive institutional buying volume flows back into the market. This triggers an aggressive, vertical vertical expansion phase that rockets through local resistance structures to peak near 1.16010 before establishing a distribution range.
To systematically extract pips from these swift momentum expansions without succumbing to emotional trading, professional market makers deploy specialized smoothing indicators. This is where the advanced mathematical modeling of the Qema Direction Indicator provides a powerful competitive edge.
The Science of Quadruple Exponential Smoothing
Traditional moving averages—even Exponential variants (EMA)—suffer from an inherent technical tradeoff: smoothing out noise invariably introduces operational lag. By the time a traditional moving average reflects an intraday trend change on an M1 chart, a significant portion of the price expansion has already taken place.
The Qema script completely eliminates this limitation by applying a quadruple exponential smoothing algorithm over raw tick data. This advanced configuration minimizes curve lag while creating a highly responsive baseline:
- Real-Time Trend Tracking: Overlaid smoothly across the M1 candles, the solid crimson tracking line operates as a dynamic equilibrium zone. When Price Action remains pinned safely above this boundary during the vertical rally from 11:55 onward, the tool signals an undisputed institutional markup, advising scalpers to look exclusively for compounding buy entries.
- Instant Reversal Confirmation: Notice the exact moment the market bottoms out near 1.15870. The precise structural turn is flagged instantly as a clean, high-volume candle closes decisively above the Qema line. This serves as an objective structural breakout trigger long before retail oscillators register a shift.
- Filtering Deceptive Counter-Trend Pullobacks: During minor mid-session consolidations, price occasionally moves sideways. Because the Qema algorithm factors in structural acceleration velocity rather than simple chronological time, it stays stable, preventing traders from falling for weak counter-trend traps.
Upgrading Your Technical Execution Framework
Achieving long-term profitability requires moving away from subjective chart interpretations. Automating your trend bias with a professional-grade tracking script removes emotional fatigue from your intraday routine. The indicator’s customizable backend parameters allow you to fine-tune lookback sensitivities, adapt color profiles to match your personal template, and configure real-time audio alerts the exact moment a structural line crossover occurs. Integrating this robust algorithmic framework into your MetaTrader infrastructure provides the clarity needed to identify institutional turning points and protect your capital with clinical discipline.4 tools at IndicatorForest.com
2 Downloads
Last Update:
May 20, 2026 16:10 PM
Published:
Jan 18, 2026 17:57 PM
Category: