Master Market Predictions with the RDI Forecast Indicator
In the highly competitive world of Forex trading, the ability to anticipate future price movements is what separates successful traders from the rest. While most technical indicators are reactive—meaning they lag behind current Price Action—the RDI Forecast Indicator is designed to be proactive. By analyzing historical data cycles and current momentum, this advanced tool provides traders with a projected path of price action, allowing for more strategic entries and exits.
What is the RDI Forecast Indicator?
The RDI Forecast is a predictive technical analysis tool that plots projected price channels or "forecast lines" directly onto the chart. Unlike standard oscillators that stay at the bottom of the screen, the RDI Forecast lives alongside price action, using a series of specialized algorithms to calculate where the market is likely to head next.
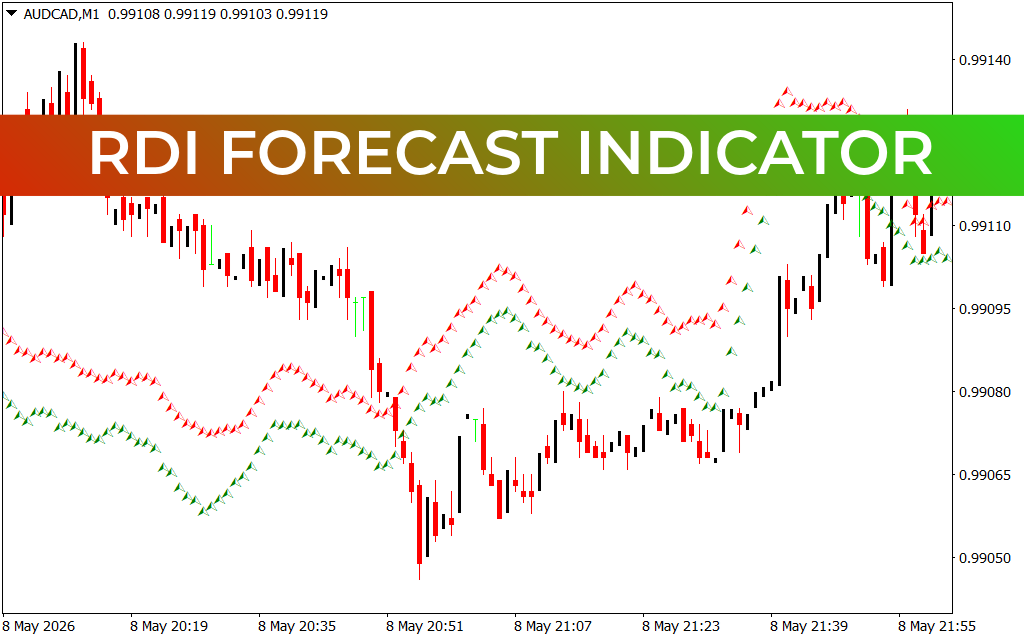
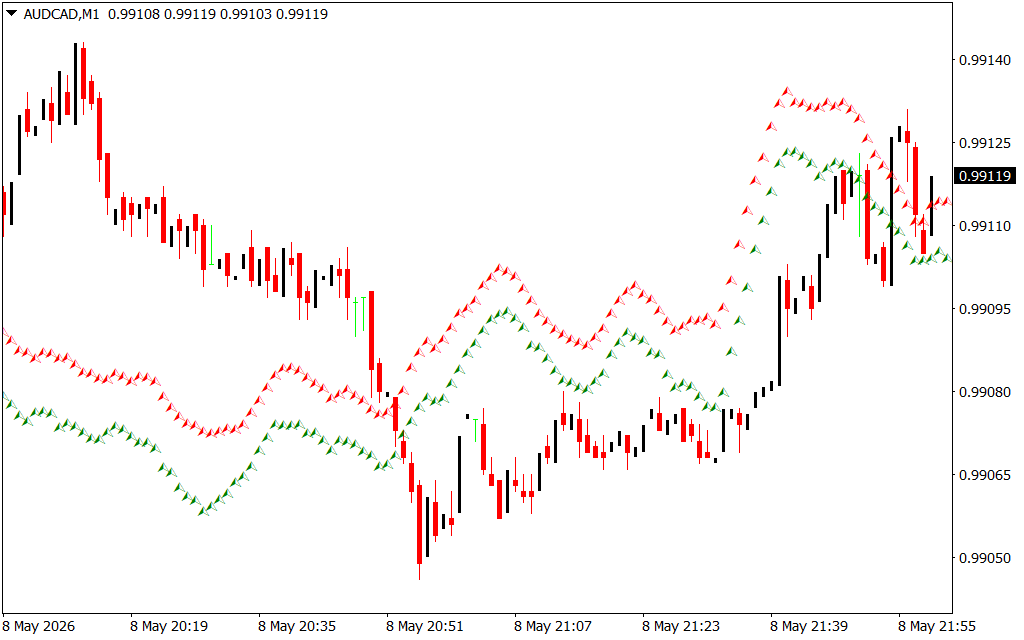
As seen in the uploaded AUDCAD M1 chart, the indicator often manifests as a series of color-coded arrows or dots (red and green) that form wave-like structures. These waves represent the "forecasted" boundaries of price, helping traders visualize potential swing highs and swing lows before they fully materialize.
Key Features and Performance Benefits
The RDI Forecast Indicator offers several unique advantages for modern MetaTrader users:
- Anticipatory Analysis: Instead of telling you what happened, it suggests what might happen. This helps traders prepare for breakouts or reversals well in advance.
- Dynamic Wave Structure: The indicator utilizes green arrows to represent bullish forecasted paths and red arrows for bearish paths. The "oscillation" of these lines helps identify the rhythm of the market.
- Scalping Precision: On lower timeframes like the M1 or M5, the RDI Forecast is exceptionally effective at identifying quick "mean reversion" opportunities where price deviates too far from the projected forecast.
- Visual Simplicity: Despite the complex math running in the background, the visual output is intuitive. When price is trading above the forecast lines, momentum is strong; when it dips below, a correction may be imminent.
Strategic Implementation
To get the most out of the RDI Forecast, traders typically use it as a "roadmap" rather than a blind signal generator.
- Trend Confirmation: Look for the forecast waves to slope upward with green signals during a bullish trend. When the actual price action aligns with the RDI projection, the probability of a successful trade increases.
- Overextended Markets: If price moves significantly far away from the RDI Forecast "cluster," it often indicates an overbought or oversold state. Traders can look for price to "magnetize" back toward the forecast lines.
- Confluence with Price Action: The indicator works best when paired with traditional Support And Resistance levels. If the RDI Forecast predicts a move into a major resistance zone, it provides a powerful signal to look for a short entry.
Conclusion
The RDI Forecast Indicator is a sophisticated addition to any technical analyst’s toolkit. By moving beyond lagging data and providing a visual projection of market cycles, it empowers traders to stay one step ahead of the crowd. Whether you are a fast-paced scalper or a disciplined day trader, this indicator provides the forward-looking perspective necessary to navigate today’s volatile markets.
3 Downloads
Last Update:
May 09, 2026 12:10 PM
Published:
Jan 25, 2026 12:16 PM
Category: