The Renko Charts Indicator for MT4 is a powerful and modern trading tool that displays market movements through price-based blocks rather than time or volume. This unique approach makes it easier for traders to identify trends, Support And Resistance levels, and clear chart patterns. Because Renko charts filter out market noise, they give traders a simplified and more focused view of Price Action. As a result, the Renko Charts Indicator for MT4 has become a popular addition to many forex trading strategies.
What Makes Renko Charts Different
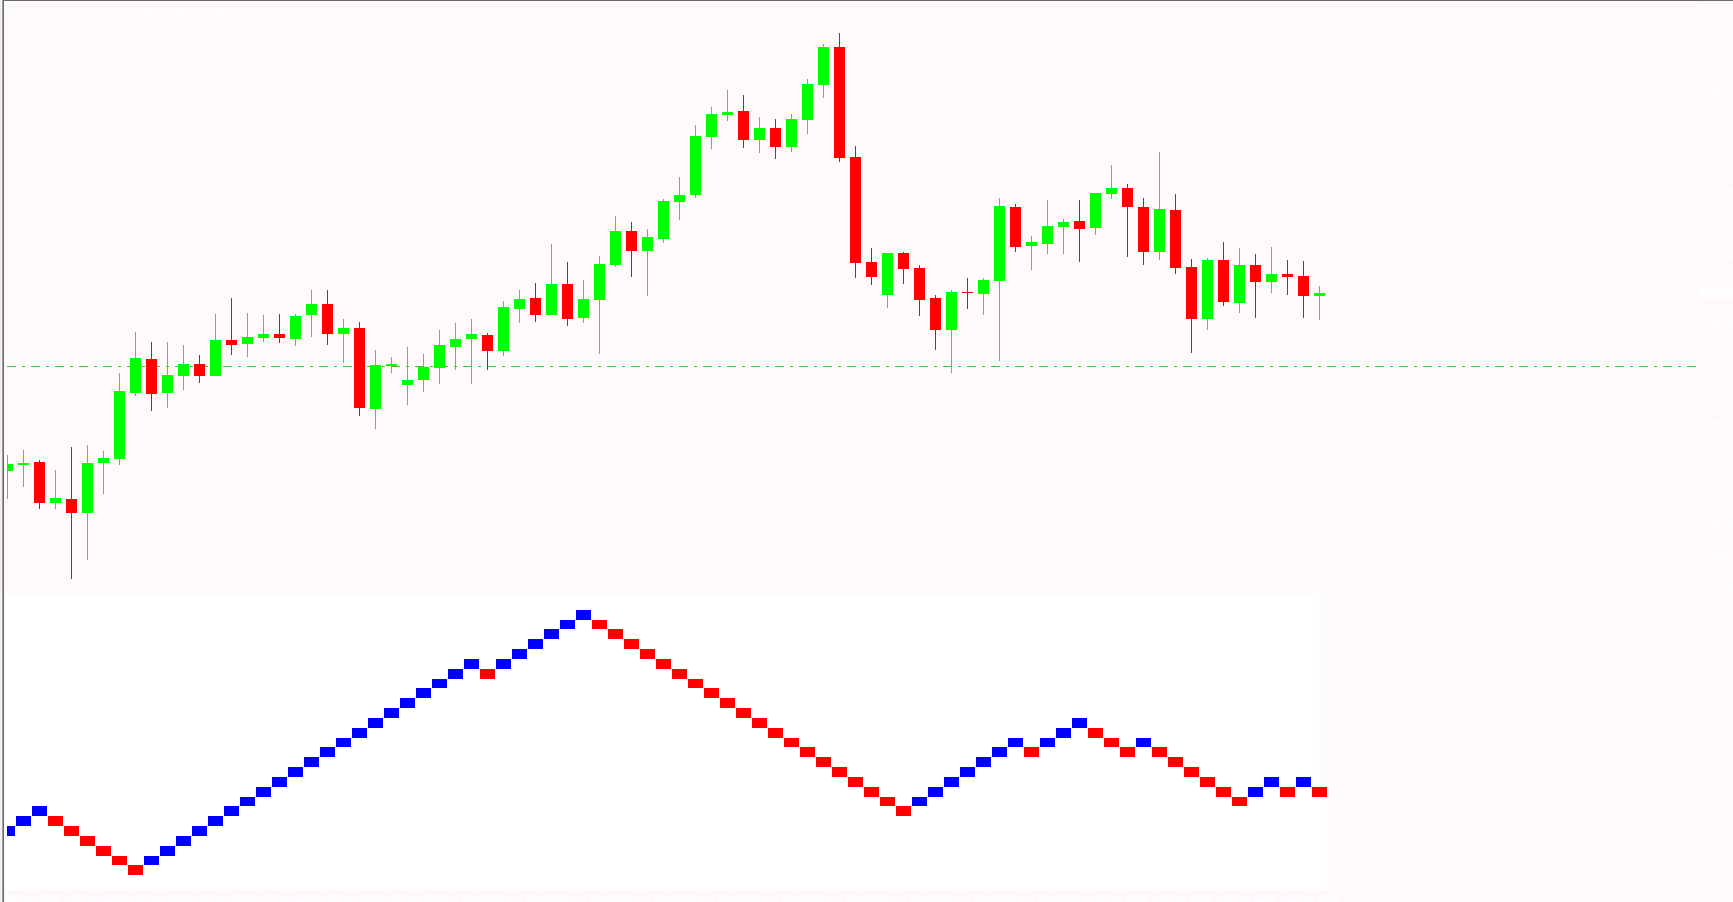
Traditional candlestick charts display price based on time intervals, which can introduce noise, volatility spikes, and distracting price fluctuations. Renko charts, however, form new blocks only when the price moves a fixed number of pips in one direction. This filtering effect allows traders to see the true underlying trend without unnecessary market noise.
Each block represents pure price movement, helping traders easily analyze market conditions such as:
Support and resistance levels
Market reversals
Chart patterns such as double tops, double bottoms, and breakouts
Because of their clarity, Renko charts are often used by price-action traders who prefer clean and objective market views.
Highly Customizable and Easy to Use
The Renko Charts Indicator for MT4 is beginner-friendly while offering advanced customization for experienced traders. Users can adjust the block size, colors, and other style settings to match their strategy. For example, smaller block sizes reveal shorter-term movement, while larger block sizes make long-term trends clearer.
Customizable features include:
Block size (pip value)
Box color and style
Trend direction highlighting
Display modes for different market instruments
These options allow traders to tailor the indicator to their preferred level of precision and market approach.
Combining Renko Charts with Other Indicators
Renko charts can be used on their own, but many traders find the best results when combining them with additional tools. Because Renko charts simplify price action, they work well with momentum, volatility, and trend indicators such as:
Moving Averages
MACD
RSI
Support/Resistance indicators
Breakout tools
This creates a well-rounded trading system that helps validate trend changes, confirm entry signals, and manage risk more effectively.
Benefits of Using the Renko Charts Indicator for MT4
Noise-Free Market View
Renko charts remove unnecessary fluctuations, giving traders a cleaner perspective on price movement and eliminating confusing market spikes.
Clear Trend Identification
The block structure makes it easy to identify when a trend is strong, weakening, or reversing.
Support and Resistance Detection
Renko chart formations clearly outline horizontal support and resistance zones, helping traders plan entries and exits.
Ideal for Multiple Strategies
The indicator is suitable for:
Trend trading
Swing trading
Breakout strategies
Regardless of market conditions, Renko charts provide reliable and consistent price-action clarity.
Free and Reliable
The Renko Charts Indicator for MT4 is free to use, lightweight, and highly stable. It integrates smoothly into the MT4 platform, making it accessible to both new and experienced traders.
Why You Should Use the Renko Charts Indicator
Traders appreciate Renko charts for their simplicity, accuracy, and ability to highlight true market direction. Whether you want to analyze long-term trends or short-term price movements, this indicator helps you make informed trading decisions with minimal noise. It is a valuable addition to any trader’s charting toolbox.
Try the Renko Charts Indicator Today
To experience a cleaner and more effective way to analyze market trends, download the Renko Charts Indicator for MT4 at IndicatorForest.com and start building a smarter price-action trading system.
FAQ
2 Downloads
Published:
Dec 12, 2025 09:44 AM
Category: