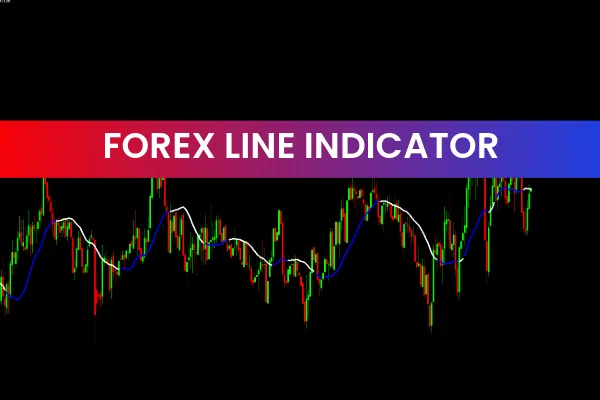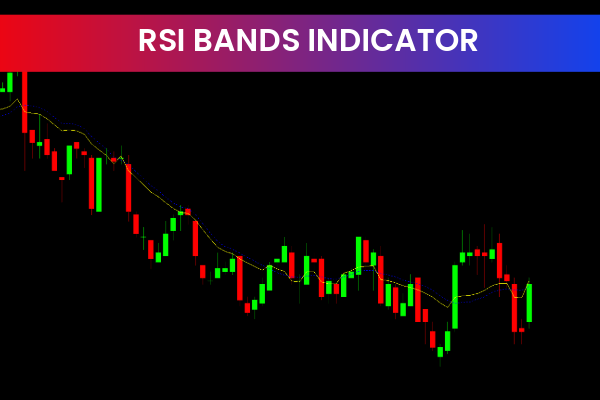
The RSI Bands Indicator is a popular and free Forex trading tool for the MetaTrader 4 (MT4) platform. Designed to help traders identify potential trading opportunities, this indicator builds on the widely used Relative Strength Index (RSI) to provide enhanced signals for profitable trading.
By combining the RSI with upper and lower bands, the RSI Bands Indicator allows traders to visually see overbought and oversold levels. This makes it easier to identify potential buy and sell signals, as well as key areas of support and resistance in the market. Its simplicity and effectiveness make it a favorite among both beginner and experienced Forex traders.
How the RSI Bands Indicator Works
The RSI Bands Indicator is based on the Relative Strength Index (RSI), a Momentum Indicator that measures the magnitude of recent price changes to evaluate whether a currency pair is overbought or oversold.
The RSI Bands Indicator enhances the standard RSI by plotting upper and lower bands around the RSI line. These bands act as dynamic thresholds:
When the RSI reaches the upper band, the market is considered overbought, signaling a potential sell opportunity.
When the RSI reaches the lower band, the market is considered oversold, signaling a potential buy opportunity.
This method provides traders with a clearer understanding of market momentum and potential reversal points.
Key Features of the RSI Bands Indicator
Overbought and Oversold Signals
The indicator highlights potential sell and buy zones based on band levels.
Support And Resistance Identification
The upper and lower bands act as dynamic areas of resistance and support.
Visual and Easy to Interpret
RSI Bands are plotted directly on the chart, making it simple to analyze market conditions.
Multi-Timeframe Application
The indicator can be applied to any timeframe, supporting intraday, swing, and long-term trading strategies.
Momentum-Based Analysis
By combining RSI with bands, traders gain insight into both Trend Strength and potential reversals.
How the RSI Bands Indicator Can Benefit You
Better Trade Timing
The bands help traders enter and exit trades at more optimal points.
Reduced False Signals
Dynamic band levels filter out minor price fluctuations, improving signal reliability.
Versatility
The indicator works across multiple currency pairs and timeframes.
User-Friendly
Its visual design and clear signals make it suitable for all levels of Forex traders.
How to Use the RSI Bands Indicator Effectively
Apply the indicator to your MT4 chart.
Watch for the RSI to reach the upper or lower bands for potential sell or buy signals.
Confirm signals using support and resistance levels, trendlines, or other indicators.
Avoid trading in low-volatility markets, as signals may be less reliable.
Many traders combine RSI Bands with moving averages, MACD, or Price Action analysis for improved accuracy.
Why Forex Traders Choose the RSI Bands Indicator
The RSI Bands Indicator is favored for its ability to combine momentum analysis with dynamic support and resistance, giving traders a clear view of overbought and oversold conditions. Its easy-to-read signals make it an essential tool for technical analysis and trade planning.
For more free MT4 indicators and professional trading tools, visit IndicatorForest.com to explore a comprehensive library of Forex resources.
Final Thoughts
The RSI Bands Indicator is a powerful MT4 Forex tool that enhances the classic RSI by adding upper and lower bands to identify overbought and oversold market conditions. Its clear signals and easy-to-read chart display make it ideal for traders looking to spot profitable trading opportunities.
Call to Action:
Discover more free MT4 Forex indicators and elevate your trading strategy today at IndicatorForest.com.
Published:
Jan 06, 2026 13:09 PM
Category: