Precision Trading with the RSI Filter Indicator V1
The Relative Strength Index (RSI) has long been a staple in the toolkit of technical analysts, prized for its ability to identify overbought and oversold market conditions. However, in trending markets, a standard RSI can often give premature signals, leading traders into "bull traps" or "bear traps." The RSI Filter Indicator V1 is designed to solve this problem by transforming the classic oscillator into a definitive trend-following filter.
Beyond the Oscillator: How the RSI Filter Works
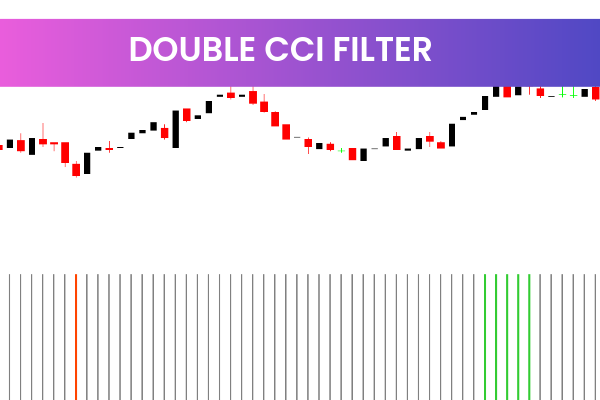
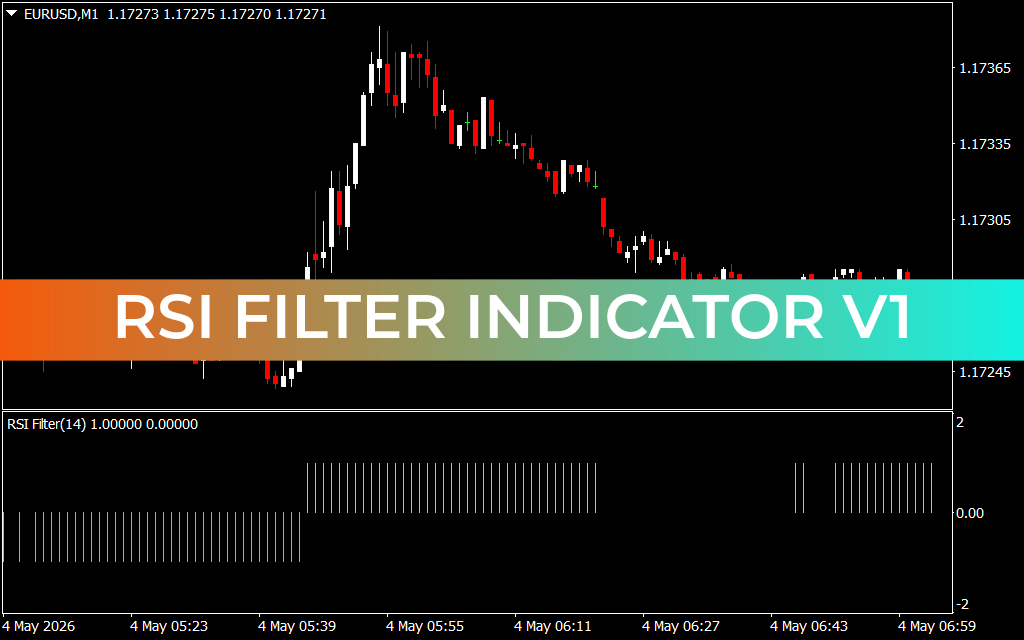
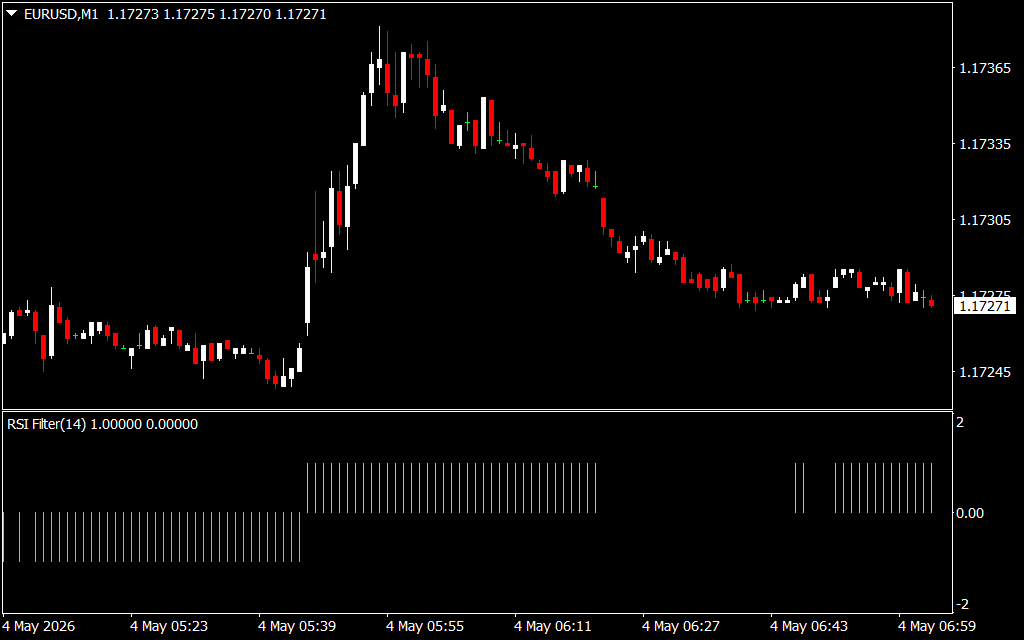
Traditional RSI indicators oscillate between 0 and 100, requiring traders to manually interpret whether a cross of the 50-level or an exit from extreme zones constitutes a valid trade. The RSI Filter Indicator V1 simplifies this process by doing the heavy lifting in the background. It analyzes price momentum and displays the result as a clean, vertical bar histogram in a dedicated sub-window.
- Blue Momentum Bars: These appear when the underlying RSI logic confirms a bullish bias. It signifies that the upward momentum is strong enough to filter out minor pullbacks, providing a "green light" for long positions.
- Orange Momentum Bars: These appear when the momentum shifts to the downside. By signaling bearish conviction, these bars help traders avoid buying into a falling market and instead look for shorting opportunities.
Scalping and Day Trading on M1 Charts
As seen in the EURUSD M1 chart, the RSI Filter V1 is exceptionally effective for high-frequency trading and scalping. On a 1-minute timeframe, Price Action can be incredibly "noisy," with dozens of false signals appearing every hour. The RSI Filter acts as a stabilizer. Notice how the indicator remains orange during the initial consolidation and only flips to blue as the explosive move upward begins.
By staying blue throughout the duration of the impulse move, it prevents scalpers from exiting their trades too early. Conversely, when the momentum exhausted at the peak, the indicator stopped printing blue bars, providing an objective exit signal before the retracement took hold.
Integrating RSI Filter V1 into Your Strategy
The true strength of the RSI Filter V1 lies in its versatility. It is not meant to be used in isolation but rather as a confirmation layer for your existing strategy.
- Trend Confirmation: If your primary Trend Indicator (like a 200-period Moving Average) says the trend is up, only take buy signals when the RSI Filter turns blue.
- Entry Timing: Use price action patterns, such as engulfing candles or support/resistance bounces, and wait for the RSI Filter bars to match the direction of your trade for maximum probability.
- False Breakout Protection: Often, price will break a level only to reverse immediately. If the RSI Filter does not change color during the breakout, it is likely a false move.
By removing the subjectivity of reading a wavy oscillator line, the RSI Filter Indicator V1 provides a binary, disciplined approach to market momentum.
1 Download
Last Update:
May 04, 2026 10:05 AM
Published:
Jan 28, 2026 17:53 PM
Category: