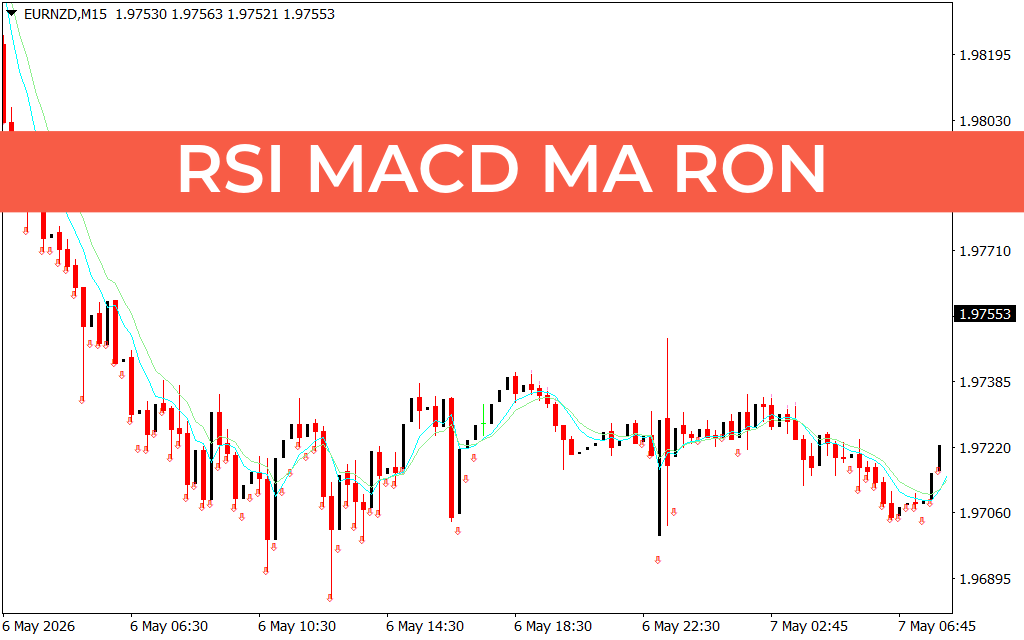
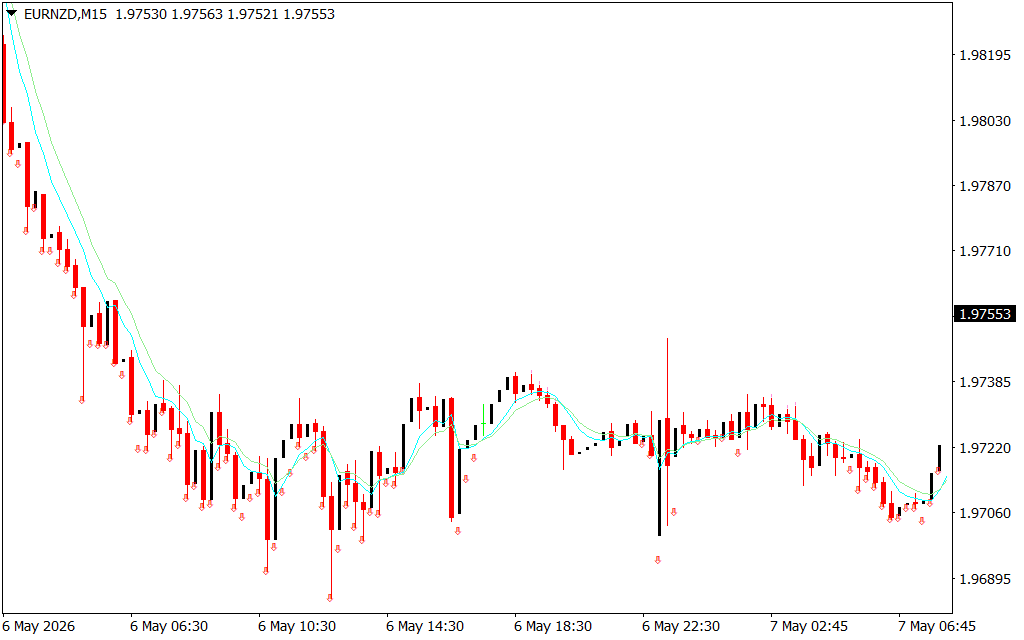
The image shows the RSI MACD MA RON indicator applied to a 15-minute (M15) chart of the EURNZD pair. This comprehensive system combines three of the most powerful technical analysis pillars—momentum, trend, and moving averages—to provide precise entry signals marked by visual arrows on the price chart.
Precision Trading with the RSI MACD MA RON Indicator for MT4/MT5
In the modern trading environment, relying on a single indicator often leads to false signals and "whipsaws." To achieve consistency, professional traders use confluence—the overlapping of multiple signals to confirm a trade. The RSI MACD MA RON indicator is a sophisticated "all-in-one" solution that automates this process, providing high-probability buy and sell signals based on the harmony of three classic technical tools.
The Power of Triple Confluence
The RSI MACD MA RON indicator filters market movement through three distinct lenses to ensure that every signal is backed by significant market force:
- Relative Strength Index (RSI): This oscillator identifies overbought and oversold conditions. By measuring the speed and change of price movements, it ensures you aren't buying at the very top or selling at the absolute bottom.
- Moving Average Convergence Divergence (MACD): The MACD component tracks the relationship between two moving averages of price. It excels at identifying changes in the strength, direction, and duration of a trend.
- Moving Averages (MA): These act as the ultimate trend filter. By smoothing out Price Action, the MA ensures that signals are only generated in the direction of the broader market trend, significantly reducing the risk of trading against the "big money."
Visual Signals and Chart Features
As demonstrated in the M15 chart, the indicator simplifies complex calculations into actionable visual cues. Small red and green arrows appear directly under or over the candlesticks, signaling potential reversal points or trend continuations.
- Bullish Signal (Green Arrow): Generated when the RSI is recovering from an oversold level, the MACD shows a bullish crossover, and price action is supported by the moving average ribbon.
- Bearish Signal (Red Arrow): Occurs when the RSI is dropping from an overbought peak, the MACD crosses into bearish territory, and price moves below the moving average lines.
Strategic Advantage for Day Traders and Scalpers
The "RON" (Range-Optimized Network) logic within the indicator is specifically tuned to handle volatility on lower timeframes like the M15 and H1. For day traders, this means fewer "fakeouts" during quiet sessions and more accurate captures of intraday trends.
Because the indicator plots the moving average ribbon directly on the chart (the cyan and lime lines), traders can also use these lines as dynamic Support And Resistance. When price pulls back to the ribbon and a signal arrow appears, it represents one of the highest-probability setups in technical trading: the trend-following pullback.
Conclusion
The RSI MACD MA RON indicator is a must-have for traders looking to streamline their workspace without sacrificing analytical depth. By combining momentum and Trend Following into a single visual system, it allows you to trade with confidence and clarity.
4 Downloads
Last Update:
May 09, 2026 00:54 AM
Published:
Jan 25, 2026 16:35 PM
Category: