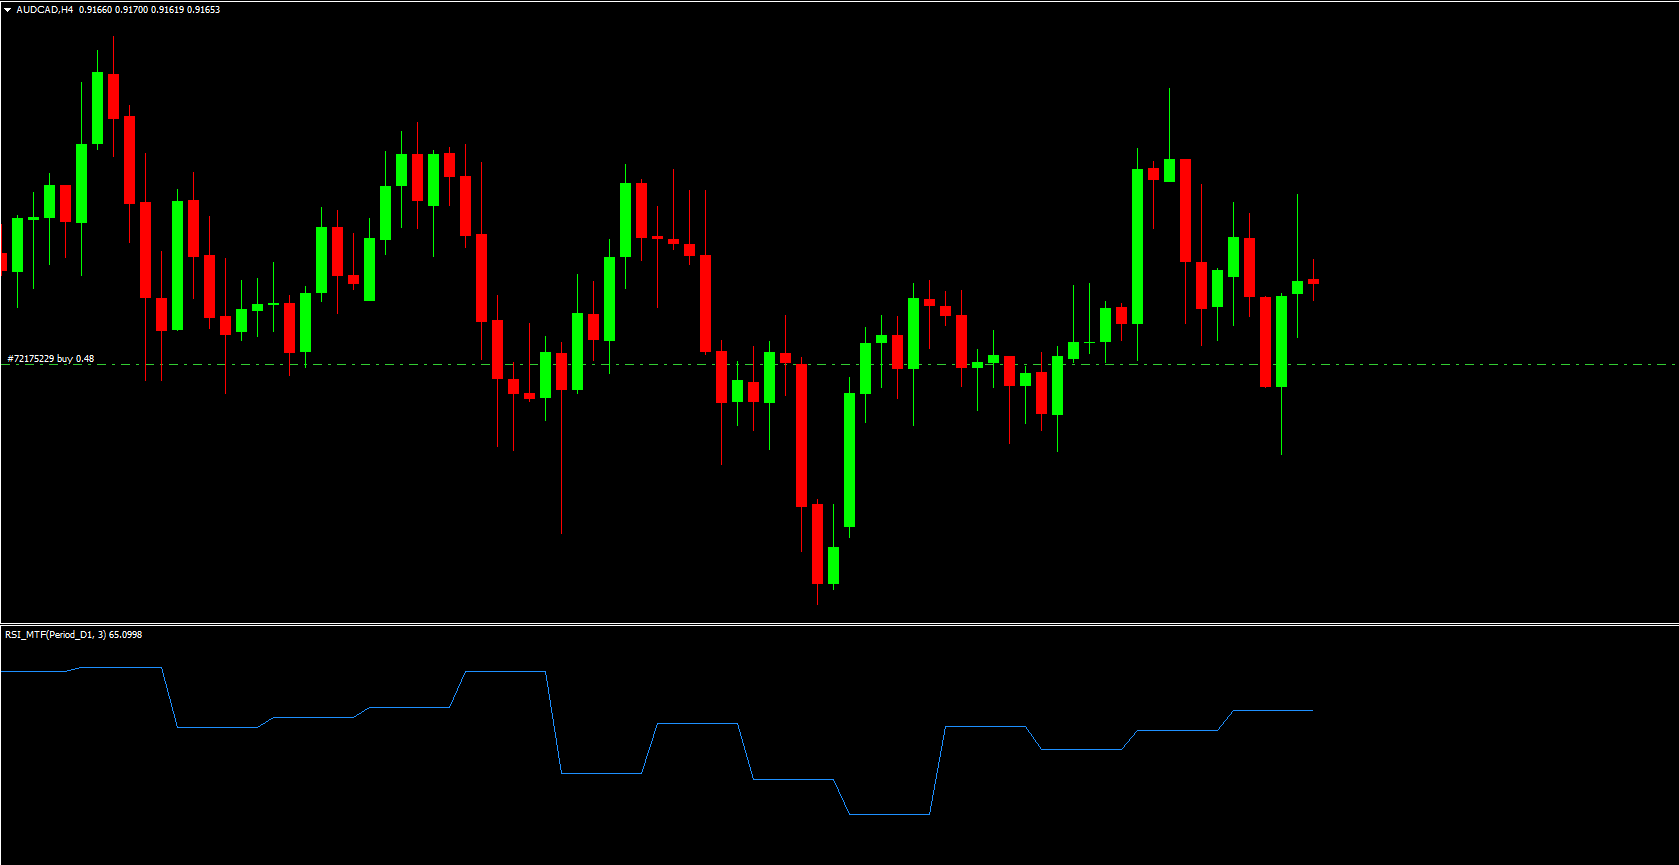
The RSI MTF Indicator for MT4 is an enhanced version of the classic Relative Strength Index (RSI). While the standard RSI is limited to one timeframe at a time, the RSI MTF indicator displays RSI readings from multiple timeframes simultaneously on the same chart.
This gives traders a broader perspective of market momentum, helping avoid misleading signals that can occur when analyzing only a single timeframe.
Why Multi-Timeframe RSI Matters
One of the biggest challenges in technical analysis is getting stuck in a single timeframe.
For example:
The M30 RSI may show an oversold condition
But the H4 RSI could still be overbought
This contradiction can lead to poor trade entries if you’re not aware of the larger trend.
The RSI MTF indicator solves this problem by allowing traders to compare RSI values from several timeframes at once.
How to Use the RSI MTF Indicator for MT4
View RSI Conditions Across Multiple Timeframes
The indicator displays RSI values from your chosen timeframes directly on the chart. This helps you quickly determine whether the market is:
Overbought (RSI > 70)
Oversold (RSI < 30)
Neutral (RSI 30–70)
Confirm Trend Strength
Seeing RSI from higher timeframes helps you gauge the dominant trend direction before taking trades on lower timeframes.
Example:
If M15 shows oversold but H1 and H4 show strong bullish momentum → the market may continue up
If all selected timeframes show overbought → a reversal may be near
Filter False Signals
Lower-timeframe RSI signals often give false entries during strong trends. With the RSI MTF tool, you can filter those out by checking higher-timeframe momentum.
Combine With Price Action
For best results, pair the RSI MTF indicator with:
Support and resistance zones
Trendlines
Chart patterns
Candlestick reversal patterns
This increases the accuracy of your entries.
Conclusion
The Relative Strength Index remains a timeless and reliable momentum indicator. The RSI MTF Indicator for MT4 makes it even more powerful by presenting RSI levels from multiple timeframes in a single window.
This expanded perspective helps you:
Identify stronger trade setups
Avoid false overbought/oversold signals
Understand overall market momentum
Download the RSI MTF Indicator for MT4 for free and enhance your RSI-based trading strategy today.
FAQ
Published:
Dec 11, 2025 09:45 AM
Category: