Unlock High-Probability Setups with the RSI MTF Indicator
One of the most frequent mistakes retail traders make is analyzing asset price trends in total isolation. Entering a trade based on a single timeframe—such as a 5-minute or 30-minute chart—without understanding the broader market direction often leads to getting caught on the wrong side of major institutional order flow. The RSI MTF (Multi-Timeframe) indicator provides an elegant, all-in-one technical solution, delivering macro momentum data from multiple timeframes directly onto a single chart layout.
Here is an analytical breakdown of how this multi-timeframe oscillator functions and how to use it to align your strategies with the broader market trend.
What is the RSI MTF Indicator?
The Relative Strength Index (RSI) is a classical technical analysis tool developed by J. Welles Wilder to calculate the speed and change of underlying price movements. However, a standard RSI requires you to manually flip back and forth between multiple windows to monitor higher-timeframe trends.
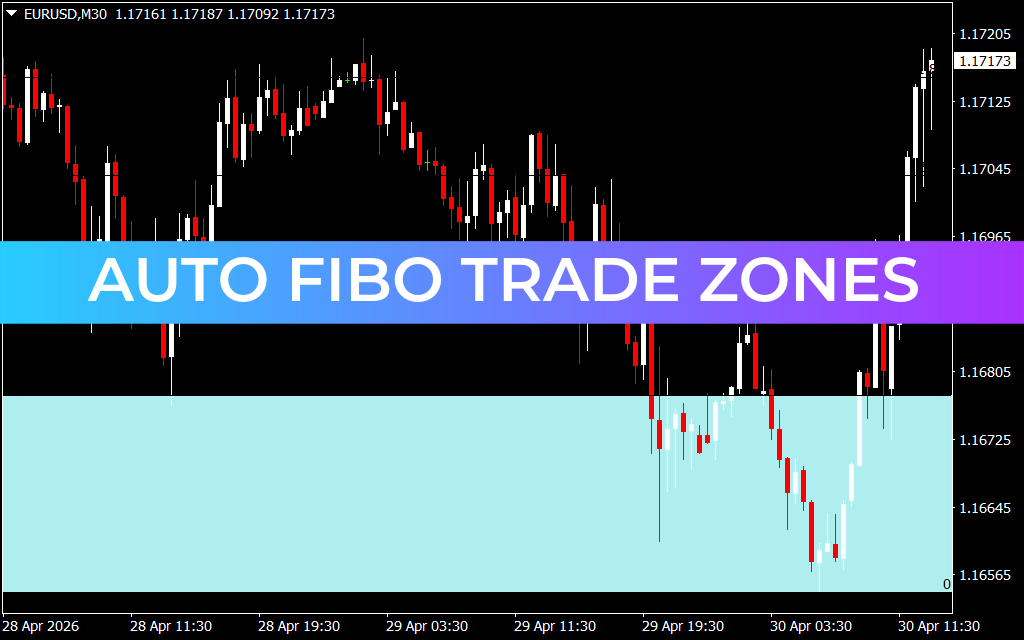
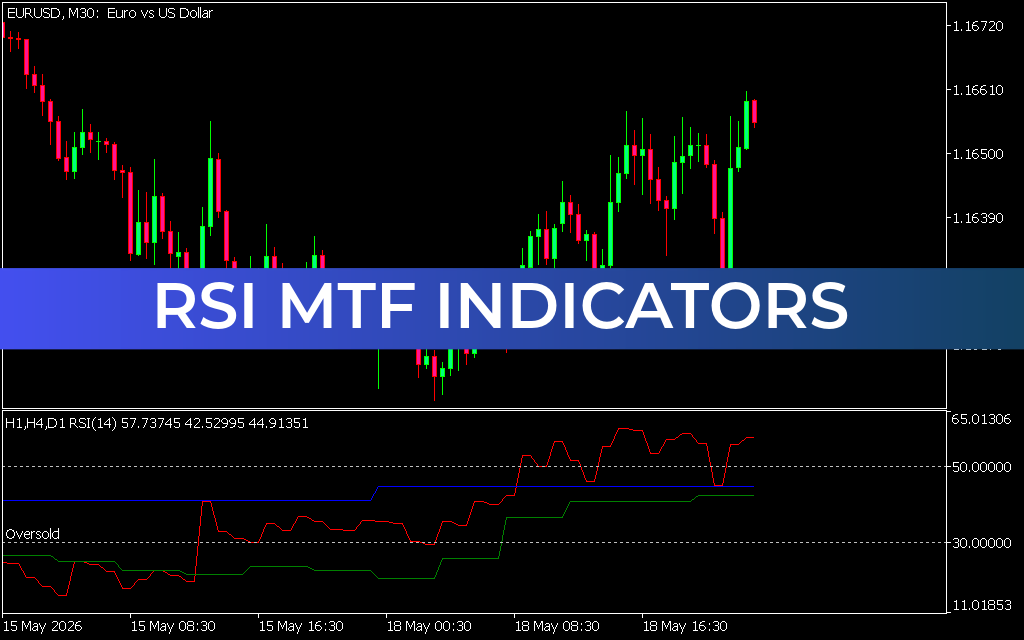
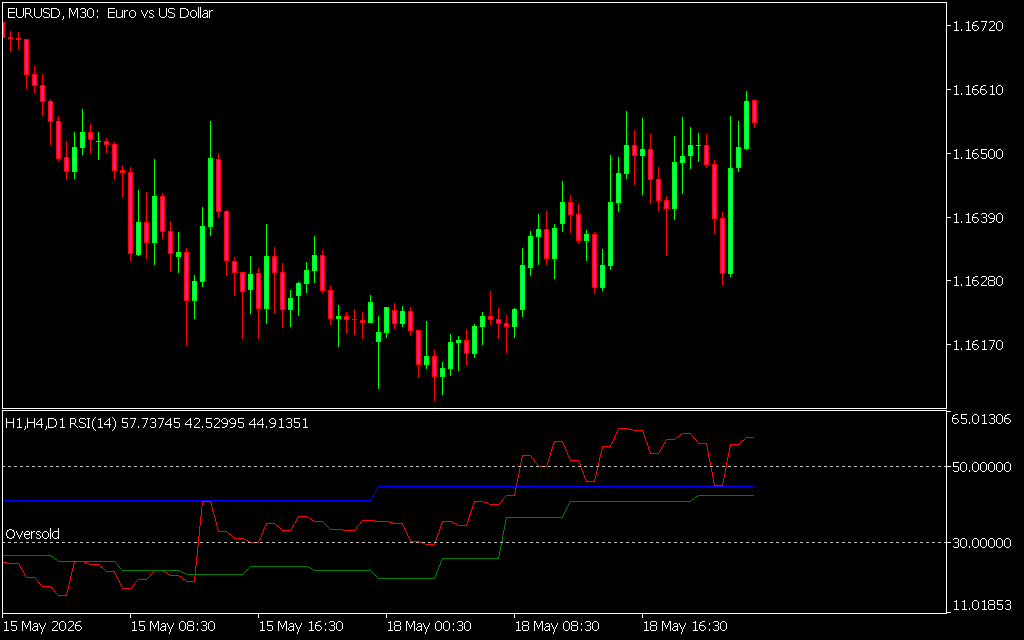
The RSI MTF indicator streamlines this analytical process by plotting multiple higher-timeframe RSI lines into a single sub-window below your current workspace. As showcased on the EURUSD M30 chart, the indicator tracks crucial momentum horizons simultaneously (such as the Hourly H1, 4-Hour H4, and Daily D1 levels) using a consolidated layout:
- The Red Signal Line: Displays the live, real-time momentum of your active trading timeframe.
- The Blue and Green Steps: Represent the dynamic historical boundaries and shifting overbought or oversold baselines recalculated from higher macro timeframes.
- The Fixed 30 and 70 Thresholds: Mark the mathematical extremes where an asset is statistically overextended.
By condensing these higher-level metrics into a single matrix, day traders can immediately verify if a local pullback aligns with long-term market expansion.
Core Strategic Advantages for Day Traders
- Eliminate Multi-Window Disorganization: You no longer need to split your monitor screen into four separate layouts just to watch changing trends across major time horizons.
- Identify True Multi-Timeframe Confluence: The indicator highlights when both short-term Scalping momentum and long-term institutional investment trends are reaching mathematical extremes simultaneously.
- Advanced False Breakout Filtering: By using the step-based higher-timeframe boundaries as a filter, you can easily ignore minor intraday counter-trend signals that run counter to macro market direction.
Practical Trading Implementations
To maximize your success with the RSI MTF indicator on MetaTrader platforms, implement these core execution rules:
- The Institutional Trend-Alignment Entry: Look for instances where the higher-timeframe indicators (such as H4 and D1) are holding safely above the 50 baseline, confirming a structural macro uptrend. When the lower-timeframe red signal line drops into the 30 oversold zone, treat this structural confluence as a high-probability trigger to purchase the asset at an institutional discount.
- The Multi-Timeframe Exhaustion Reversal: Watch for rare, high-impact sessions where the RSI lines for all selected timeframes hit an extreme boundary simultaneously. If the active, H1, and H4 lines all spike past the upper 70 overbought threshold, it signals structural exhaustion across the entire market matrix—setting up a premium opportunity to look for a sharp mean-reversion short trade.
2 Downloads
Last Update:
May 19, 2026 01:54 AM
Published:
Jan 19, 2026 20:40 PM
Category: