Decoding Higher-Timeframe Momentum with the RSI MTF V1 Indicator
In the financial markets, single-timeframe analysis often paints an incomplete picture. A lower-timeframe entry might look perfectly bullish, only for the trade to instantly reverse because it crashed directly into a major macro resistance level. To prevent this common pitfall, professional technical analysts rely on multi-timeframe (MTF) analysis. The RSI MTF V1 indicator automates this advanced workflow, bringing the structural momentum of larger market cycles directly into a single sub-window on your MetaTrader platform.
What is the RSI MTF V1 Indicator?
The Relative Strength Index (RSI) is globally recognized as an essential momentum oscillator, measuring the speed and change of price movements to identify overbought or oversold conditions. However, tracking the RSI across multiple charts forces traders to constantly switch tabs, causing cognitive fatigue and execution delays.
The RSI MTF V1 indicator solves this operational friction. It calculates and plots the RSI values of several higher timeframes simultaneously inside your current working window. By tracking macro momentum alongside your micro execution chart, this technical tool ensures that your day trading or Scalping setups are constantly aligned with the broader institutional order flow.
Understanding the Multi-Timeframe Interface
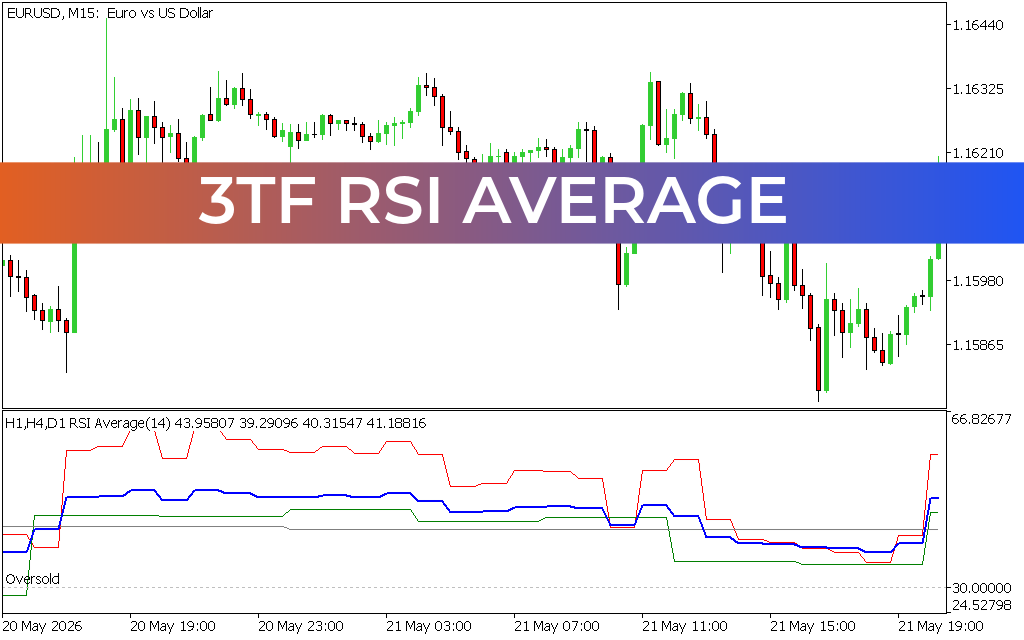
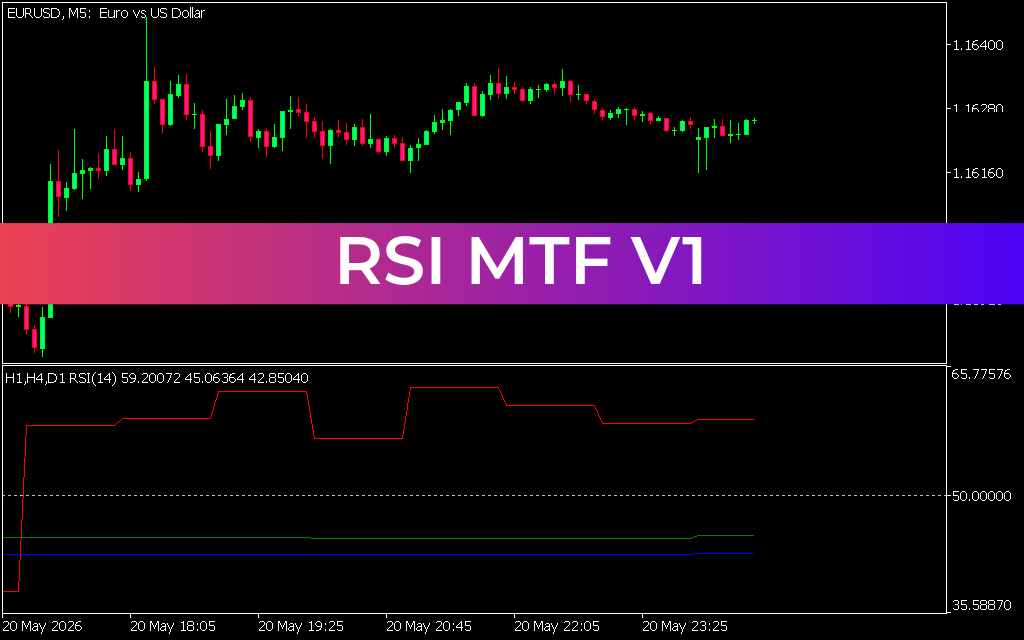
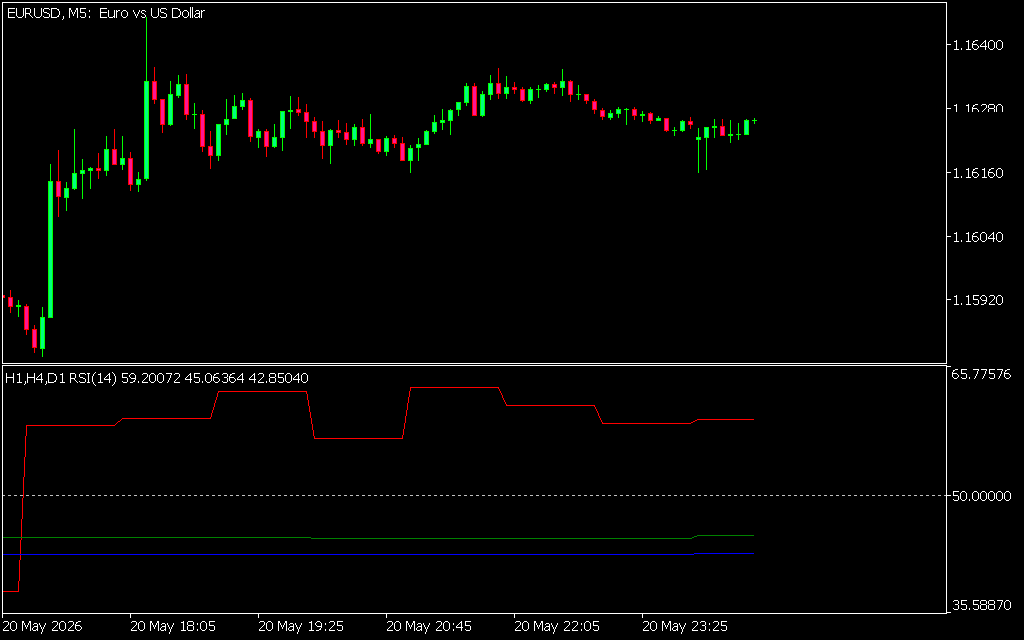
As demonstrated on a 5-minute (M5) execution chart for the EUR/USD pair, the RSI MTF V1 displays a clean, color-coded multi-line dashboard positioned directly beneath the main price feed:
- Simultaneous Trend Tracking: The indicator plots separate lines representing chosen higher timeframes—such as the 1-hour (H1), 4-hour (H4), and Daily (D1) charts. For example, the dynamic red line represents the leading macro-momentum curve, while the green and blue baselines show the underlying long-term structural bias.
- The 50.00000 Midline Compass: The $50.0$ line acts as the ultimate filter for market equilibrium. When the higher-timeframe RSI lines are sustained comfortably above $50.0$, it indicates that macro buyers control the market. Conversely, when the lines sit below the midpoint, the macro environment is structurally bearish.
By presenting this data as stepped, synchronized intervals, the system lets you spot exactly when multiple timeframes line up into a high-probability momentum block.
Professional Multi-Timeframe Strategies
To maximize the mathematical edge of the RSI MTF V1 indicator, combine its signals into a structured, top-down strategy:
- Momentum Confluence Breakouts: Look for periods where the H1, H4, and D1 RSI lines all break above the $50.0$ midline simultaneously. This alignment indicates a massive wave of institutional volume, making any lower-timeframe long breakout highly likely to succeed.
- Counter-Trend Filter: If your execution chart shows a short-selling setup but the RSI MTF V1 shows that the H4 and Daily lines are locked in deep overbought territory above $60.0$, skip the trade. The macro trend is too strong to fight, saving you from a costly premature top-fade.
By integrating the RSI MTF V1 indicator into your strategy, you strip away chart clutter and unlock the clarity needed to trade in harmony with the broader market trend.
1 Download
Last Update:
May 21, 2026 02:37 AM
Published:
Jan 18, 2026 13:52 PM
Category: