Precision Momentum Trading with the RSIOMA Lines Histogram
In the high-stakes arena of Forex trading, the Relative Strength Index (RSI) is a staple for measuring momentum. However, standard RSI can often be volatile, leading to premature entries or "whipsaw" exits. The RSIOMA Lines Histogram is an advanced evolution of this classic tool, designed to provide a smoother, more reliable view of market sentiment. By applying a Moving Average to the RSI (RSIOMA), this indicator filters out minor price fluctuations to reveal the true underlying trend.
Decoding the RSIOMA Mechanics
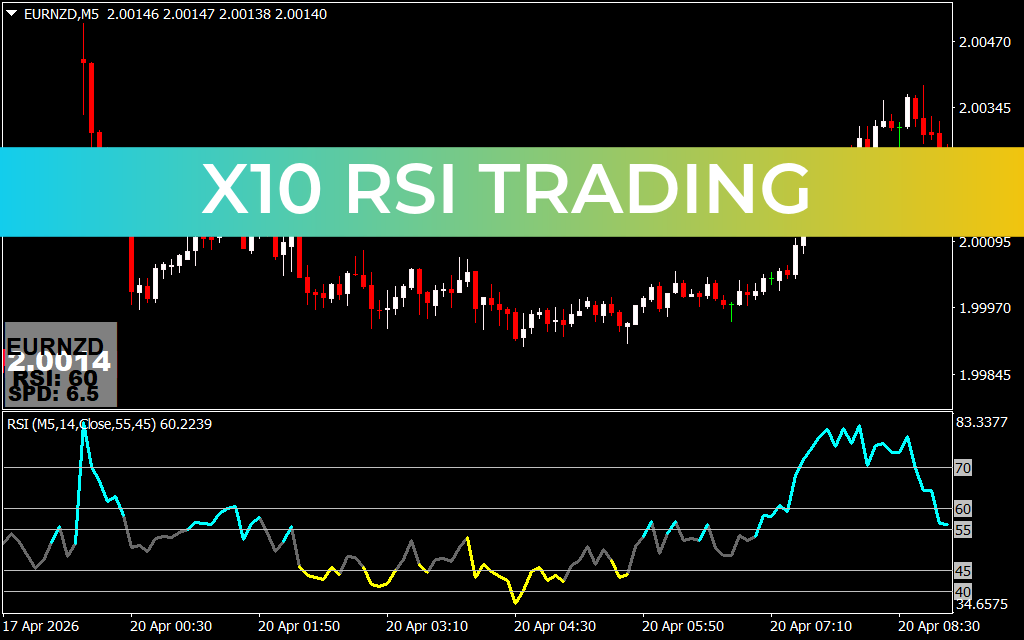
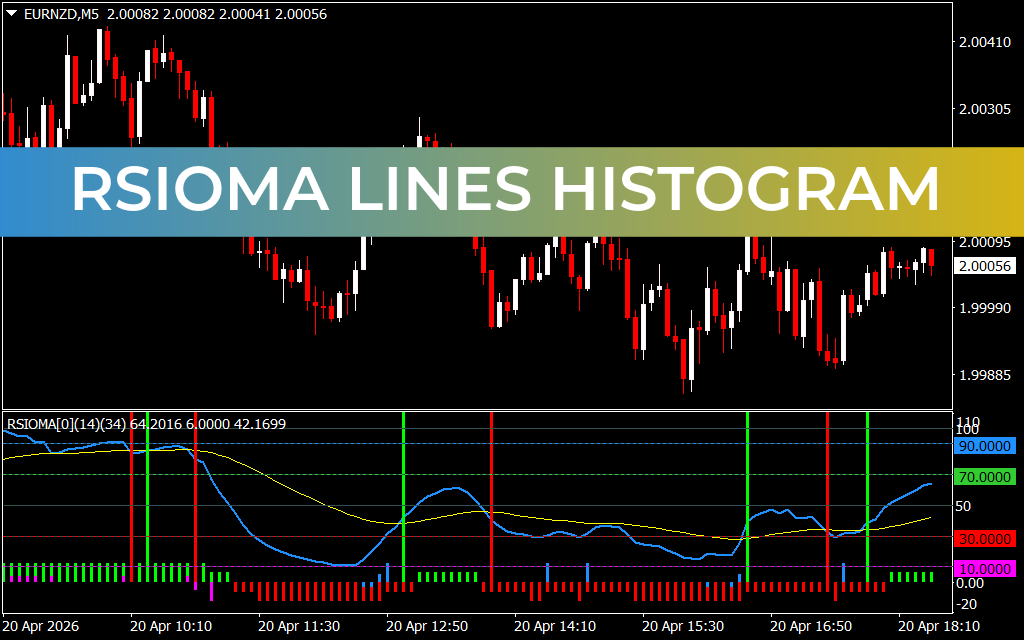
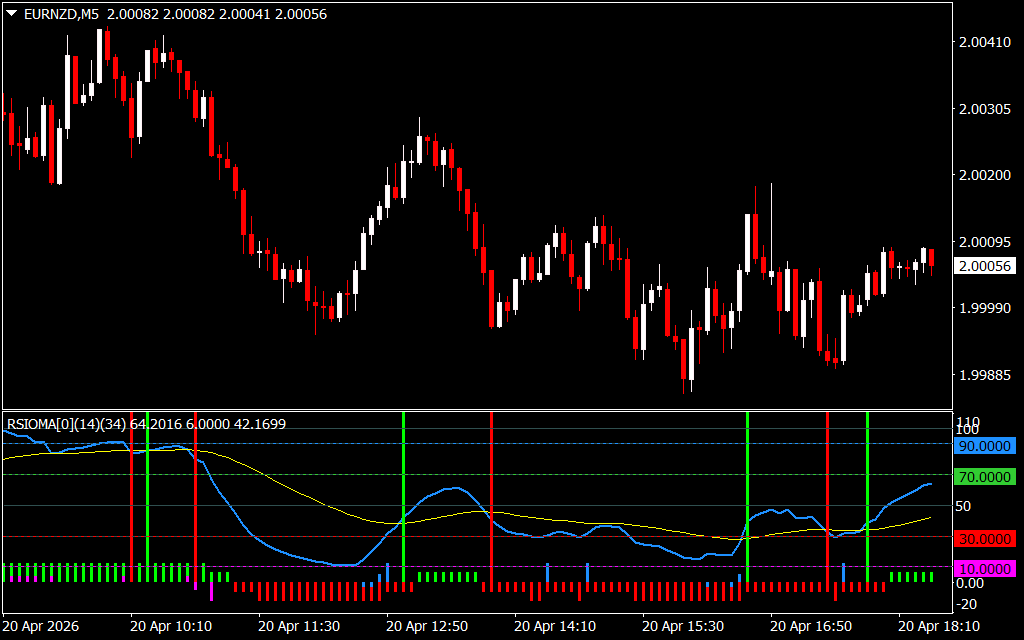
The RSIOMA system operates on the principle of confluence between price momentum and trend direction. As visualized on the EURNZD M5 chart, the indicator consists of three primary components that work in harmony to guide trading decisions:
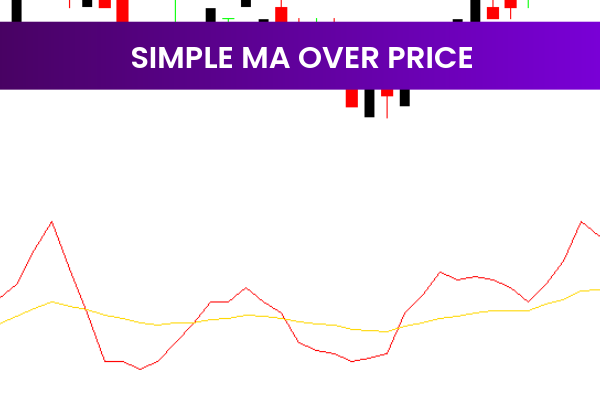
- The RSIOMA Lines: The blue line represents the smoothed RSI, while the yellow line acts as its signal moving average. When the blue line crosses above the yellow line, it signals a bullish shift; a cross below indicates bearish dominance.
- The Trend Histogram: Located at the base of the indicator window, the histogram provides immediate visual confirmation.
- Green Bars: Confirm strong bullish momentum.
- Red Bars: Highlight sustained bearish pressure.
- Magenta/Blue Bars: Often signal transitional phases or the start of a deep retracement.
- Vertical Alert Lines: The indicator automatically plots vertical green and red lines across the sub-window to mark the exact moment of a confirmed trend shift, ensuring traders never miss a high-probability entry point.
Strategic Application: Overbought and Oversold Zones
One of the most powerful features of the RSIOMA Lines Histogram is its use of fixed horizontal levels (30, 50, 70, and 90). For a scalper on the 5-minute (M5) timeframe, these levels act as critical "action zones."
- The Bullish Surge: A move where both lines cross above the 50-level, accompanied by green histogram bars, signals an explosive Trend Continuation.
- Extreme Reversals: When the RSIOMA lines penetrate the 90-level (overbought) or the 100-level and then cross back inward, it provides a surgical signal for a potential reversal trade.
- The 50-Level Pivot: The 50-line serves as the "waterline." Staying above it keeps you in a buy bias, while staying below it confirms a sell bias.
Why Every MetaTrader Setup Needs RSIOMA
The primary advantage of the RSIOMA Lines Histogram is filtering. While a standard RSI might bounce sporadically between levels, the RSIOMA maintains a clear direction, allowing you to ride trends longer and with more confidence.
By integrating this indicator into your MetaTrader platform, you gain a multi-layered momentum dashboard. It doesn't just tell you if the market is overbought; it tells you exactly when the momentum is shifting back in your favor. Whether you are Scalping EURNZD for quick pips or using it as a trend filter for higher timeframes, the RSIOMA Lines Histogram provides the surgical edge required to succeed in today’s volatile markets.
7 Downloads
Last Update:
Apr 20, 2026 21:36 PM
Published:
Feb 03, 2026 16:48 PM
Category: