Master Quick Profits: How to Trade Successfully with a Scalping Histogram Indicator
Scalping is one of the most exhilarating trading styles in the Forex market. By capturing small price movements across rapid timeframes—like the 5-minute (M5) chart—traders can stack consistent gains throughout the day. However, navigating the noise of lower timeframes requires precision. That is where a specialized tool like a Scalping Trading Histogram becomes a game-changer for your technical analysis.
What is a Scalping Trading Histogram?
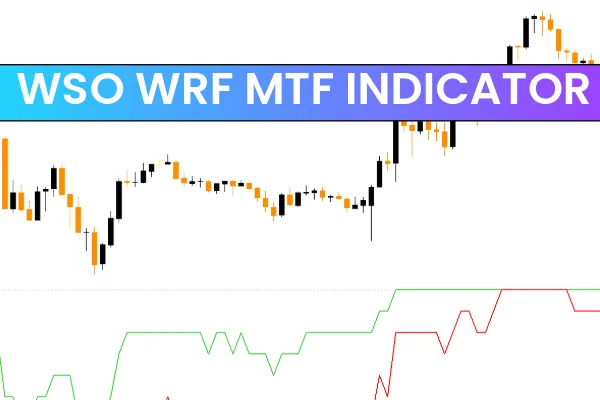
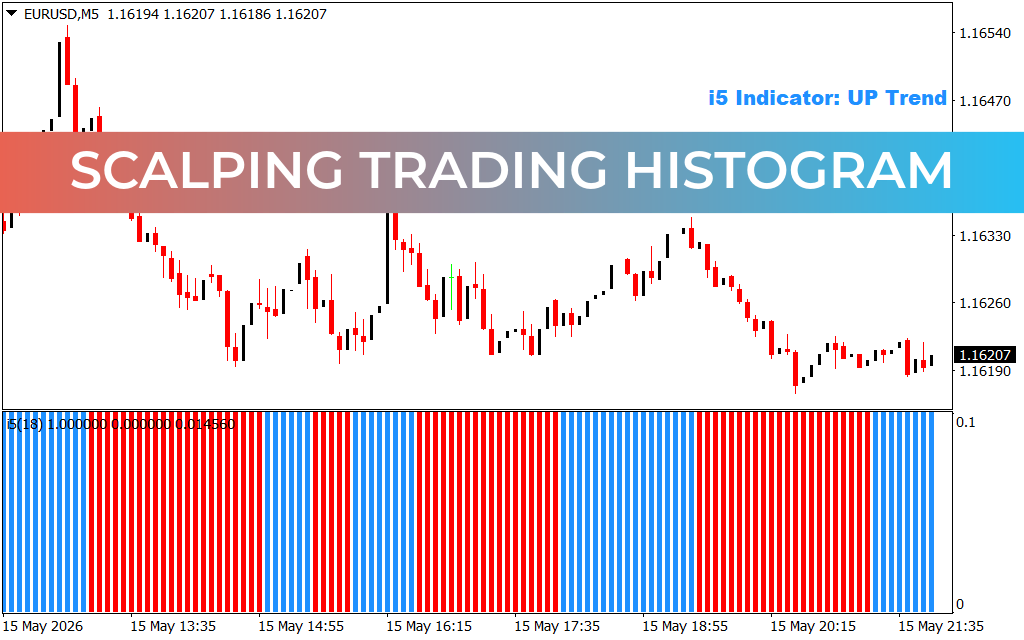
A scalping histogram is a visual technical indicator designed to simplify trend identification. Positioned in a separate window below your main price chart, it translates complex mathematical calculations into simple, color-coded vertical bars.
Typically, these indicators utilize two primary colors to dictate market momentum:
- Blue/Green Bars: Signal a bullish (upward) momentum, indicating ideal environments for buy setups.
- Red Bars: Signal a bearish (downward) momentum, showing prime conditions for sell setups.
By filtering out standard market "noise," the histogram provides traders with a clear, binary view of who is currently winning the battle: the bulls or the bears.
The Power of the i5 Indicator in Action
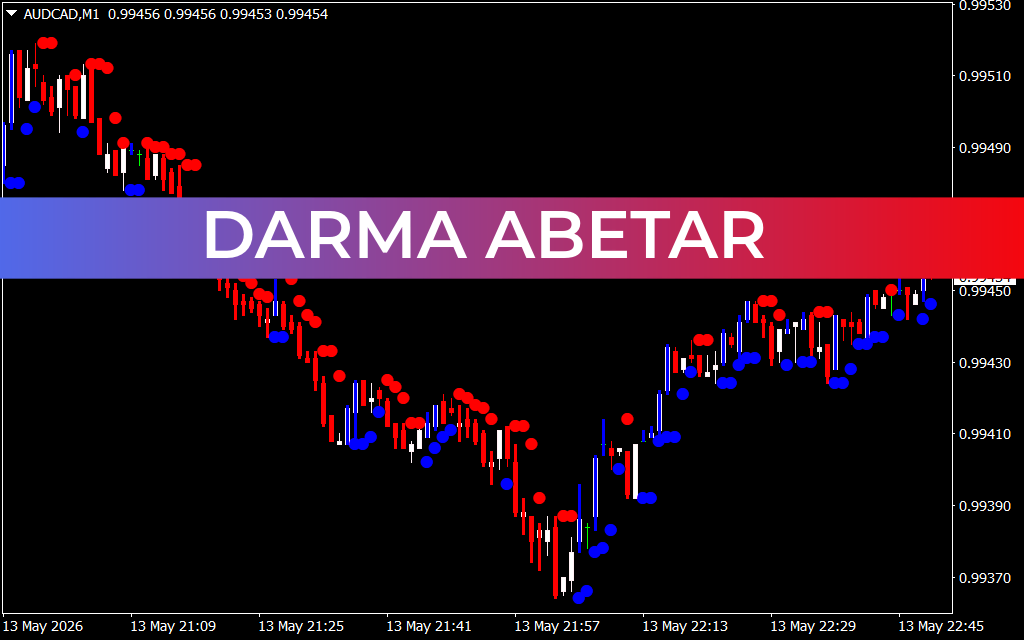
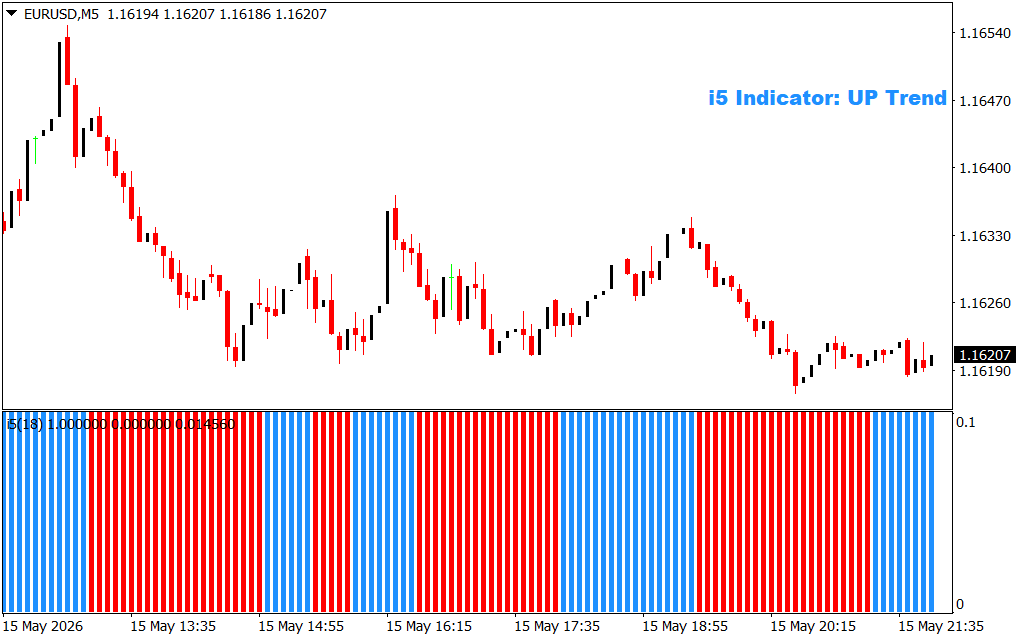
As seen in standard M5 setups, indicators like the i5 Indicator analyze Price Action over a specific period (e.g., an 18-period setting) to display the micro-trend instantly.
When the market shifts from a severe downtrend to a consolidation phase, trying to guess the reversal point can lead to heavy losses. The histogram removes the guesswork. Even if the price action looks choppy on the candlestick chart, a dominant block of blue bars boldly prints the underlying truth: the market structure is shifting to an UP Trend.
How to Build a Winning Scalping Strategy
To maximize the win rate of a scalping histogram, it should never be used in complete isolation. Instead, combine it with core price action principles:
- Trend Alignment: Identify the macro trend on a higher timeframe (like the M15 or H1). If the higher timeframe is bullish, only take buy signals when your M5 histogram turns blue.
- Support And Resistance: Wait for the price to hit a key horizontal support level. If the histogram flips from red to blue exactly at that level, you have a high-probability trigger to enter a long position.
- Strict Risk Management: Because scalping targets small pip movements, your stop-loss must be tight. Place your stop just below the recent swing low and aim for a quick, realistic 1:1 or 1:1.5 risk-to-reward ratio.
Ultimately, a scalping trading histogram turns overwhelming market data into actionable visual cues, giving fast-paced traders the discipline and edge they need to succeed.
7 Downloads
Last Update:
May 16, 2026 14:53 PM
Published:
Jan 21, 2026 01:40 AM
Category: