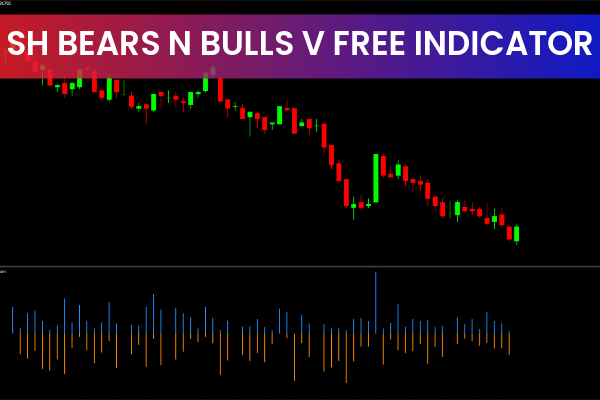
The SH Bears n Bulls V Free Indicator for MT4 displays a clear histogram showing the strength of buyers and sellers in any selected timeframe. This helps forex traders decide whether to follow the bulls or the bears and build effective buy or sell strategies. Because the indicator visually represents market strength, it becomes extremely useful for making confident trading decisions.
The tool is simple to use and works for beginners as well as advanced traders. It is compatible with all chart timeframes—from intraday to daily, weekly, and monthly—making it suitable for every trading style.
Discover More
Algo Trading • MetaTrader 4 • MT4 • MT5 • Algorithmic Trading • MT4 Trade • MetaTrader 5 • MT4 Platform Guide • MT4 Templates Collection • MetaTrader 5 Platform
SH Bears n Bulls V Free Indicator for MT4 Trade Setup
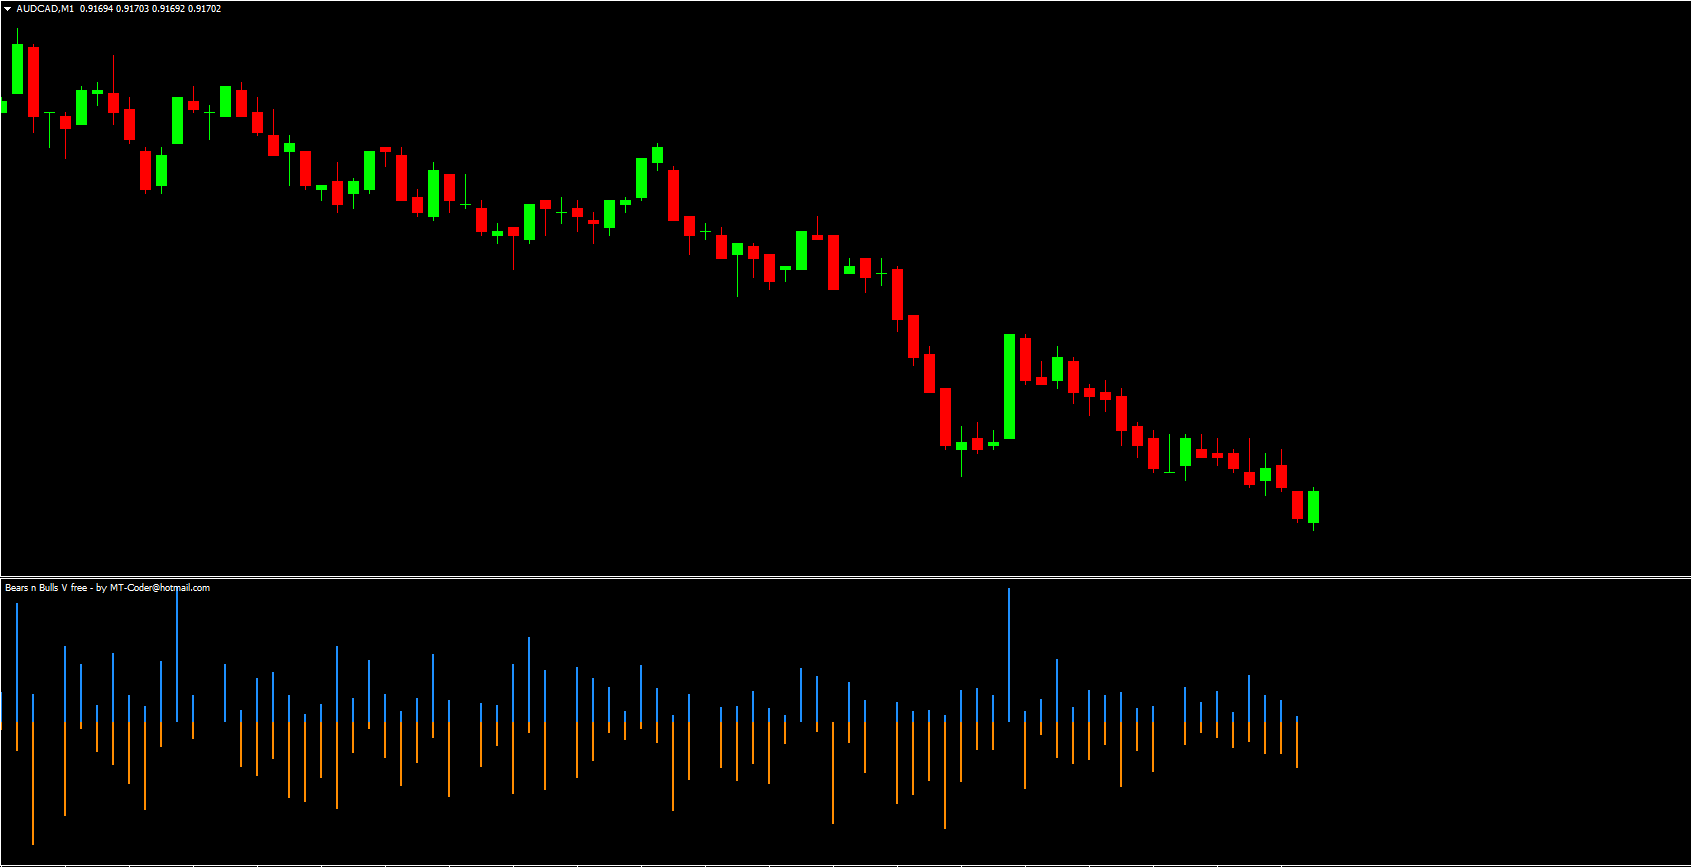
The indicator generates blue and red histogram bars around the zero level.
Blue bars signal bullish strength.
Red bars signal bearish strength.
A simple yet effective approach is to remain bullish when blue bars dominate and bearish when red bars are stronger.
When blue bullish bars appear, traders can look for buy entries. A stop loss below the previous swing low usually protects the trade. Profit-taking becomes ideal once bearish strength begins to exceed bullish momentum.
Another powerful technique is watching for sudden spikes in strength. These spikes often hint at a potential Trend Reversal. For instance, during a downtrend, a sharp increase in strength may indicate an upcoming bullish reversal.
Conclusion
In summary, the SH Bears n Bulls V Free Indicator for MT4 provides traders with a clear understanding of market strength, helping them identify profitable trade opportunities based on buyer and seller pressure.
FAQ
1 Download
Published:
Dec 08, 2025 03:19 AM
Category: