Revolutionize Your Chart Analysis with the Haos Visual Indicator
In the complex ecosystem of Forex trading, the ability to distinguish between a healthy trend and a tiring market is what separates professional traders from the rest. Most standard oscillators provide a lagging view of price, often leading to late entries or premature exits. The Haos Visual Indicator is designed to eliminate this guesswork by providing a multi-layered, color-coded visual representation of market cycles and momentum shifts.
What is the Haos Visual Indicator?
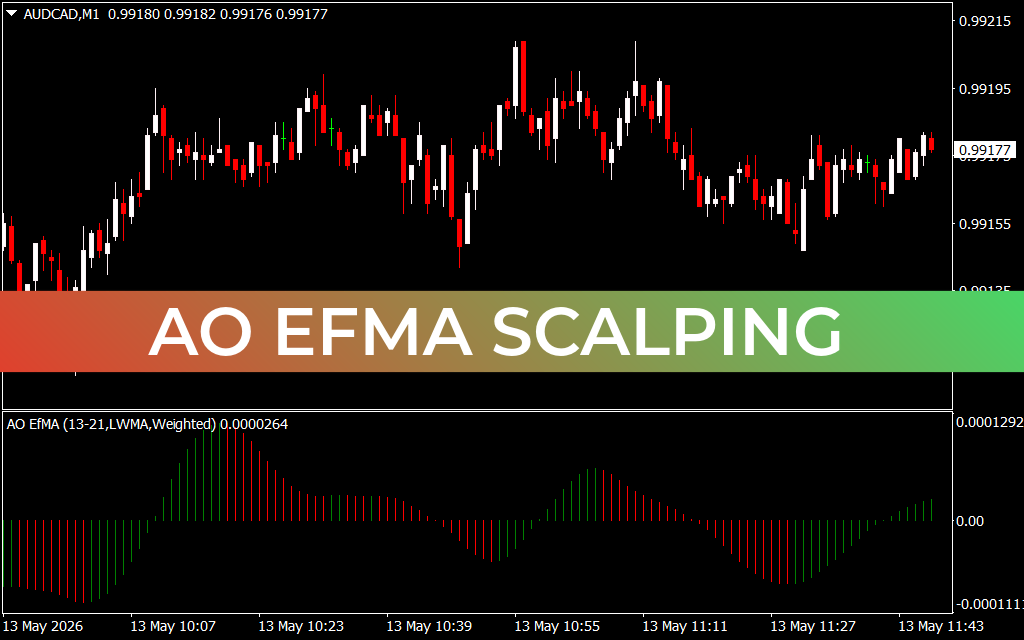
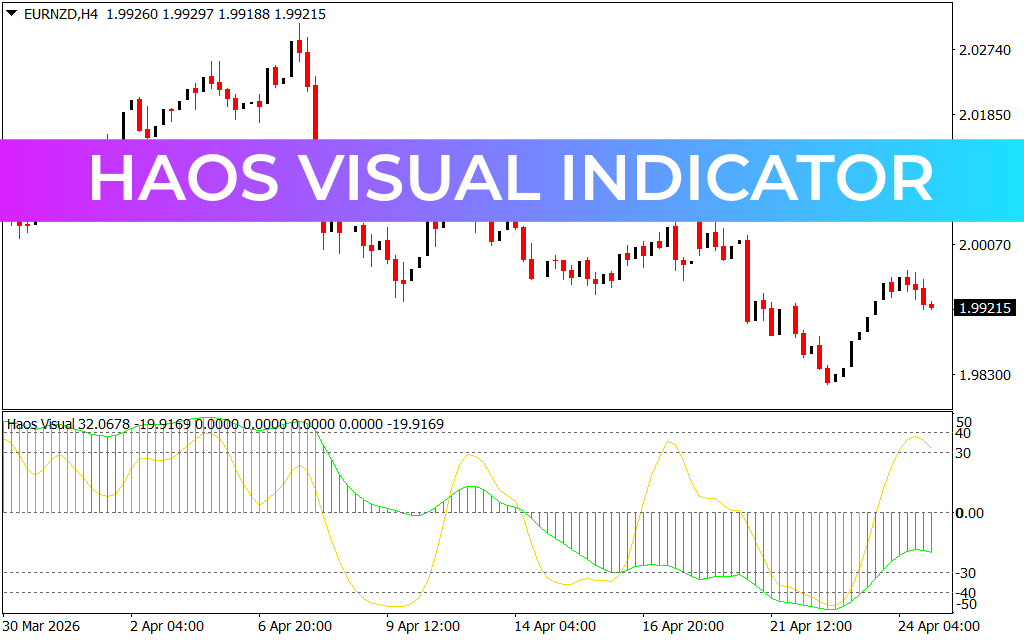
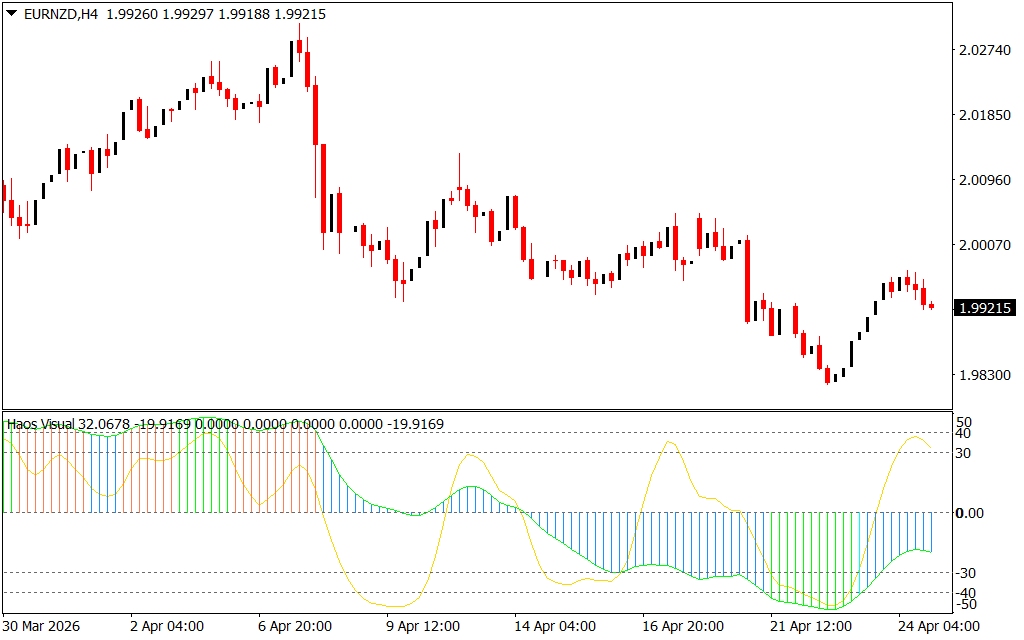
The Haos Visual Indicator is an advanced technical analysis tool for the MetaTrader platform that combines several mathematical models to track market momentum and extreme overbought or oversold conditions. As seen in the EURNZD H4 chart, it populates a sub-window with a sophisticated mix of vertical histograms and a fast-moving signal line.
What makes "Haos" unique is its use of color-coded logic to represent the state of the market. Instead of just looking at a line moving up or down, traders can instantly see the "health" of a move based on the color and height of the histogram bars, which transition through greens, blues, oranges, and reds.
Key Features of the Haos Visual System
- Multi-Cycle Tracking: The indicator tracks short-term momentum and long-term trends simultaneously. This dual-focus helps traders avoid "trading against the tide."
- Advanced Color Coding: The histogram bars change color to signal different market phases. For example, a transition from red/orange to green/blue often signals the end of a bearish cycle and the start of a bullish recovery.
- Extreme Level Alerts: The indicator features fixed levels (such as 50 and -50). When the signal lines or histograms reach these outer boundaries, it warns traders that the market is overextended and a reversal or correction is likely imminent.
- Smoothing Algorithm: Haos Visual utilizes internal smoothing to reduce market noise, providing cleaner signals compared to a standard Relative Strength Index (RSI) or Stochastic oscillator.
Strategic Trading Applications
The most effective way to utilize the Haos Visual Indicator is as a momentum confirmation tool. When the Price Action reaches a known support level and the Haos Visual histogram begins to shift from bearish orange to bullish blue, it provides a high-confidence signal to enter a long position.
Furthermore, it is a world-class tool for divergence trading. If the price makes a new high but the Haos Visual peaks are lower than the previous ones, it alerts the trader to a hidden weakness in the trend. This allows for proactive risk management, such as tightening stop-losses or taking partial profits before the market turns.
Why Choose Haos Visual?
Traders often suffer from "analysis paralysis" when looking at too many conflicting indicators. The Haos Visual Indicator solves this by condensing momentum, trend, and cycle data into one intuitive window. It is built for clarity, speed, and accuracy, making it an essential addition to any MetaTrader setup, whether you are Scalping the M15 or swing trading the Daily charts.
2 Downloads
Last Update:
Apr 25, 2026 22:35 PM
Published:
Feb 02, 2026 13:40 PM
Category: