Perfect Your Price Levels with the Simple Horizontal Grid Indicator for MT4
Clean chart organization is one of the most overlooked aspects of successful technical analysis. When your trading screen is cluttered with manual trendlines, miscellaneous objects, or chaotic visual noise, identifying key structural areas becomes a challenge. The Simple Horizontal Grid Indicator for MetaTrader 4 (MT4) addresses this problem directly by mapping out an elegant, automated, and mathematically balanced price matrix across your favorite currency pairs.
By establishing static reference blocks, this indicator helps retail traders master key market psychological zones and structure their risk management parameters flawlessly.
What is the Simple Horizontal Grid Indicator?
The Simple Horizontal Grid indicator is an automated charting utility designed to overlay a systematic matrix of evenly spaced horizontal lines onto your price screen. Instead of forcing you to manually draw coordinate lines every time you switch profiles, this tool dynamically tracks historical and current price action to anchor perfectly aligned, dashed horizontal Support And Resistance baselines.
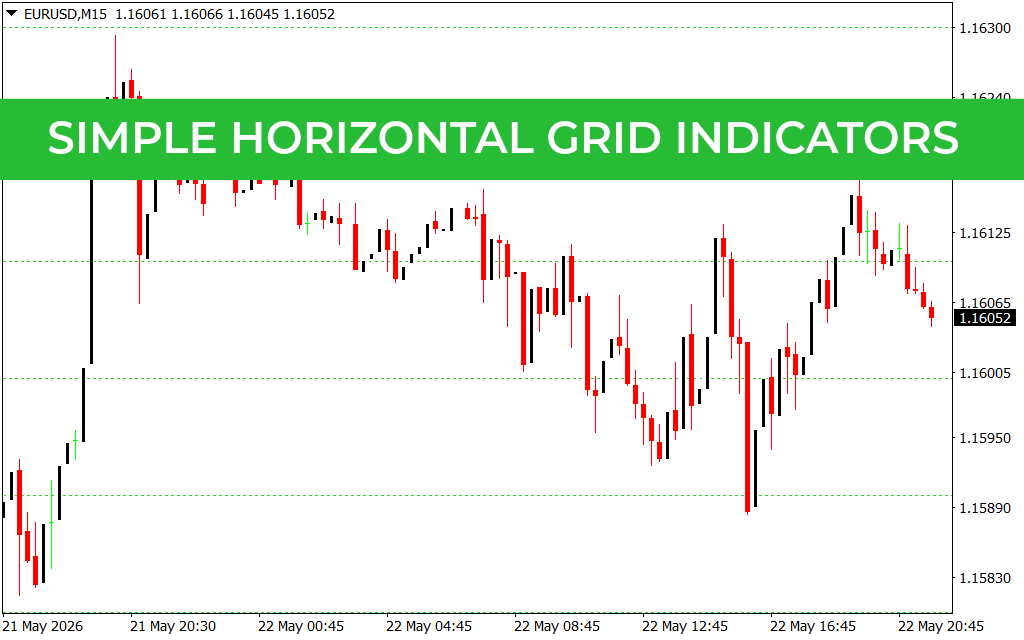
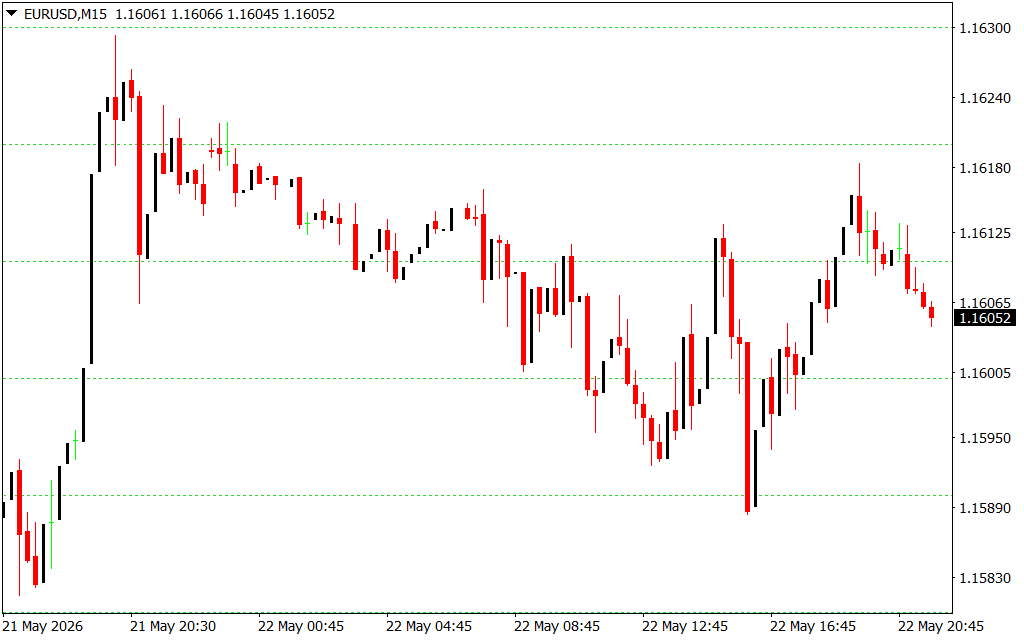
As shown on the EURUSD M15 chart, the indicator plots subtle green dashed levels at fixed pip intervals. This geometric layout allows you to gauge true price velocity, measure structural extensions, and evaluate localized consolidations relative to a balanced, grid-based architecture without interfering with your candlestick patterns.
Key Features and Benefits
- Automated Level Mapping: Instantly updates and draws horizontal intervals across your entire chart view, eliminating tedious manual setup tasks.
- Customizable Pip Spacing: Allows traders to easily modify the step size between each gridline to fit distinct trading styles, from tight Scalping grids to wide swing zones.
- Subtle Visual Styling: Employs minimalist dashed lines that blend seamlessly into dark or light chart backgrounds, keeping your essential candles perfectly legible.
- Psychological Round Number Integration: Highly effective for plotting major round numbers, institutional whole levels, and mid-points automatically.
How to Trade with the Simple Horizontal Grid Indicator
Integrating this horizontal matrix system into your trading approach offers excellent utility for executing clean, objective strategies:
- Grid Breakout Trading: During low-volatility Asian sessions, notice how price compresses inside a specific horizontal grid channel. A decisive M15 candle close above or below these grid markers signals an ideal momentum breakout trade.
- Precise Target and Stop Placements: Use the grid blocks to manage your risk parameters mathematically. For example, if your strategy risks a two-grid spacing interval for a stop-loss, you can easily target a four-grid expansion area for a perfect $1:2$ risk-to-reward ratio.
- Support and Resistance Confluence: When a technical indicator like a moving average or a Fibonacci level aligns precisely with one of the horizontal grid lines, it reinforces that level as a high-conspiracy zone for potential bounce entries.
Conclusion
The Simple Horizontal Grid MT4 indicator is the ultimate workspace organization tool for systemic traders. By providing an automated framework of clean horizontal intervals, it removes analytical clutter and allows you to view Market Structure with absolute precision.
2 Downloads
Last Update:
May 23, 2026 22:02 PM
Published:
Jan 15, 2026 21:26 PM
Category: