In forex and other financial markets, price often “remembers” previous areas of interest. In other words, prices tend to react and potentially reverse when hitting established support or resistance levels. Recognizing these levels is critical for traders aiming to make profitable decisions. The SR Levels Indicator is designed to simplify this process by automatically identifying key highs and lows on your chart.
The indicator is compatible with MT4 and MT5 platforms and works effectively on all timeframes. Whether you’re Scalping on a 5-minute chart or analyzing a daily chart for swing trades, the SR Levels Indicator highlights important price levels to watch.
Features of the SR Levels Indicator
Automatic Support & Resistance Detection: Plots significant highs and lows on the chart.
Multi-Timeframe Application: Works on all timeframes from 1-minute to monthly charts.
Visual Clarity: Makes it easy to spot potential reversal zones without cluttering your chart.
Versatile Trading Tool: Can be combined with other technical indicators for confirmation.
Free and Easy to Install: Available for both MT4 and MT5 platforms.
By highlighting key Support And Resistance areas, traders can plan entries and exits more effectively. The SR Levels Indicator does not provide direct buy or sell signals, but it provides the foundation for analyzing price reversals and breakouts.
How to Use the SR Levels Indicator
Identify Key Levels: The indicator automatically plots highs as resistance and lows as support.
Plan Your Trades: Look for potential buy opportunities near support levels and sell opportunities near resistance levels.
Confirm Signals: Use other technical tools like candlestick patterns, RSI, or moving averages to confirm potential reversals.
Set Stop Loss and Take Profit: Place stop losses slightly beyond the identified support/resistance level to reduce risk.
Example of Trading with SR Levels
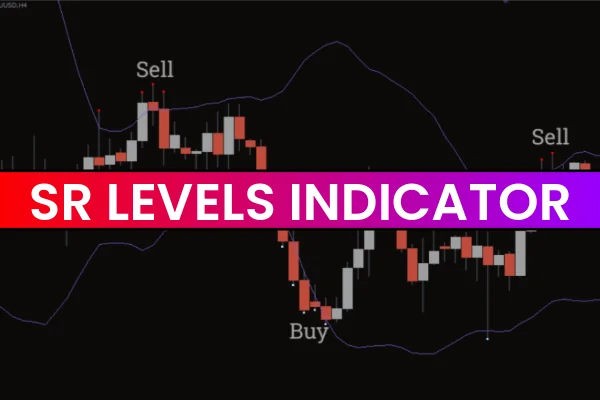
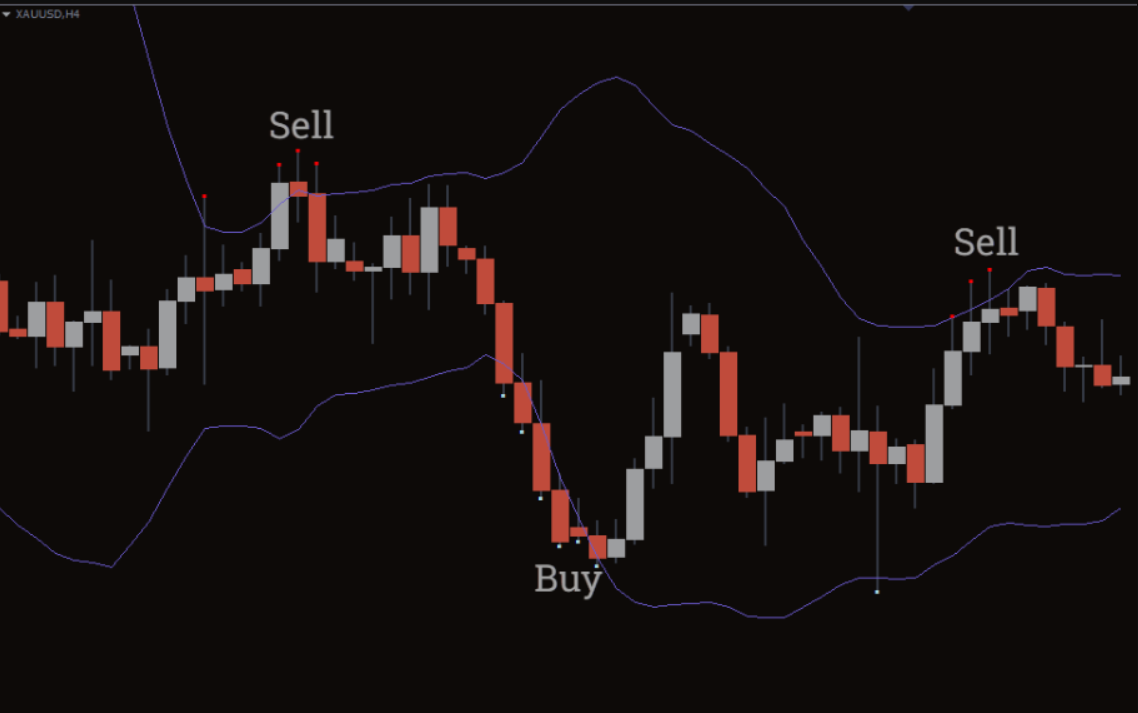
The above USD/JPY H4 chart illustrates the SR Levels Indicator in action. Highs are marked as resistance zones, and lows are marked as support zones.
When the price approaches a support level, traders can anticipate a potential bounce and look for bullish reversal signals such as a pin bar or bullish engulfing pattern.
Conversely, when the price approaches a resistance level, traders can anticipate a potential pullback or reversal and look for bearish signals.
It is important to note that the SR Levels Indicator works best when combined with other technical tools. Relying solely on support and resistance levels without confirming market trends or Price Action can lead to false signals.
Advantages of the SR Levels Indicator
Saves Time: Automatically identifies key levels, eliminating the need to manually draw support and resistance lines.
Reduces Error: Provides accurate levels based on historical highs and lows.
Applicable to All Markets: Works with forex, stocks, indices, and commodities.
Foundation for Trading Strategies: Can be used with price action, trend lines, oscillators, or other indicators.
By integrating the SR Levels Indicator into your trading setup, you can enhance your risk management and make more informed trading decisions.
Conclusion
The SR Levels Indicator for MT4 and MT5 is an essential tool for traders looking to detect support and resistance zones efficiently. Price often reacts at these key levels, making them ideal for planning entries, exits, and stop-loss placements.
While the indicator does not give direct buy or sell signals, it provides the foundation for effective technical analysis. By combining it with other indicators or price action patterns, traders can increase the probability of successful trades.
The SR Levels Indicator is user-friendly, free to download, and works across all timeframes, making it a must-have addition to any trader’s toolkit.
FAQ
5 Downloads
Published:
Dec 11, 2025 01:24 AM
Category: