Master Market Waves with the SSRS Smoothed Indicator
Identifying optimal swing high and swing low points in financial markets can be an analytical nightmare for retail traders. Standard momentum oscillators, like standard Stochastics or the Commodity Channel Index (CCI), often react erratically to short-term price spikes, producing premature or false counter-trend signals. The SSRS Smoothed indicator solves this lack of clarity by applying advanced algorithmic smoothing techniques to market cycles, giving traders a clean and accurate view of trend transitions.
Here is a comprehensive look at how this unique sub-window indicator operates and how you can apply it to your technical trading framework on platforms like MetaTrader.
What is the SSRS Smoothed Indicator?
The SSRS Smoothed indicator is a specialized momentum and cycle-tracking oscillator positioned below your main candlestick chart. The acronym SSRS is commonly associated with highly responsive Spearman Rank Correlation calculations combined with localized smoothing variables. By using a ranked statistical approach instead of simple price tracking, the indicator identifies the underlying strength of market trends rather than reacting to short-term market noise.
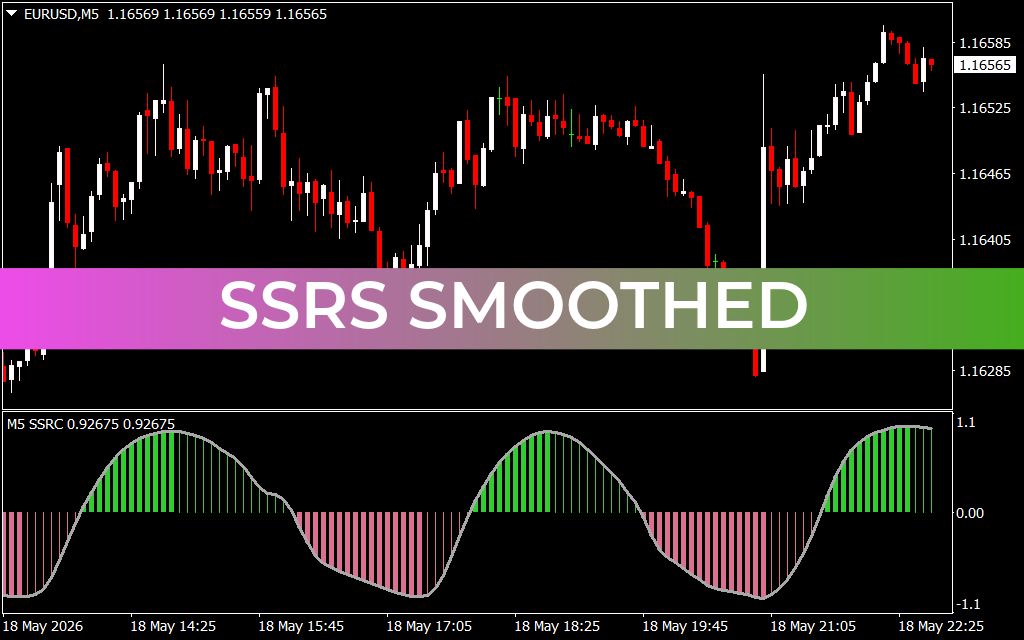
The layout consists of a smooth, silver tracking line that navigates between upper and lower historical boundaries, paired with a dual-colored momentum histogram:
- Green Histogram Bars: Indicate that market cycles have flipped positive, confirming a dominant bullish acceleration.
- Pink Histogram Bars: Signal that bearish momentum is accelerating, showing steady distribution.
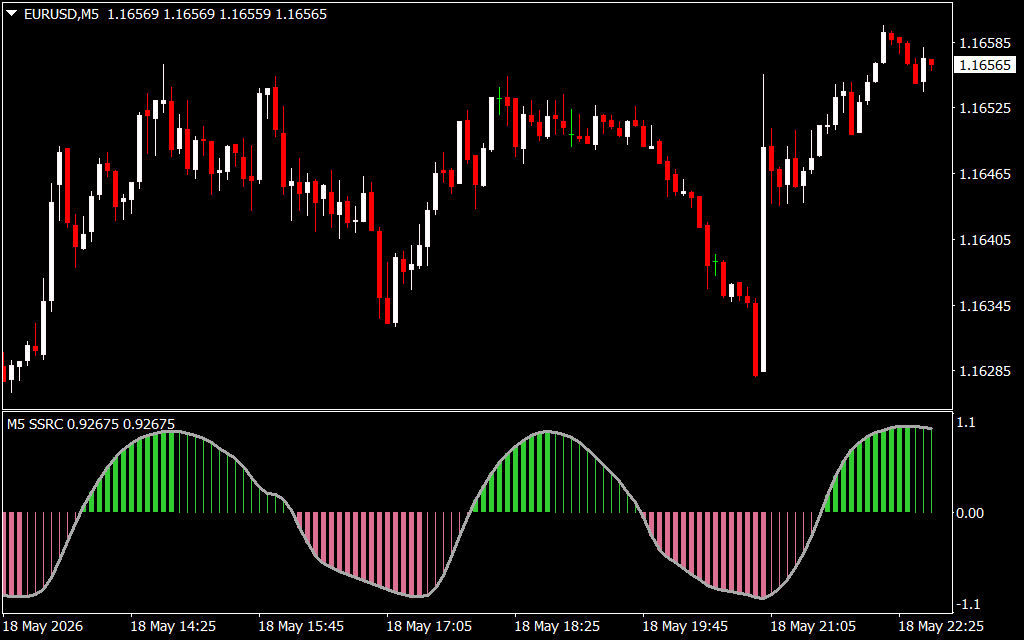
As illustrated on the EURUSD M5 chart, the indicator tracks cyclical swings cleanly. The silver line rolls over gracefully at major market turning points, and the histogram color transitions occur well ahead of standard technical lag.
Key Advantages for Swing Traders and Scalpers
- Noise-Free Cycle Analysis: By applying advanced mathematical smoothing filters, the indicator prevents premature exits during minor intraday pullbacks.
- Visual Directional Shifts: The distinct change from green to pink bars removes analytical bias, providing a clear visual cue for when momentum shifts between buyers and sellers.
- Clear Extreme Zones: The fixed 1.1 and −1.1 boundary layout clearly flags overextended market positions, indicating when an active move is approaching completion.
Strategic Implementation and Trading Rules
To incorporate the SSRS Smoothed indicator effectively into your technical setups, focus on these two foundational strategies:
- The Histogram Color-Switch Breakout: Watch for moments when the silver line rebounds from an extreme boundary zone and the underlying histogram switches colors. For a bullish entry, wait for the pink bars to completely disappear and the first green bar to print above the 0.00 baseline. Enter at the close of the corresponding candlestick, placing your stop-loss below the recent swing low.
- The Trend-Continuation Re-Entry: Pair the oscillator with a slower baseline filter, like a 100-period Exponential Moving Average (EMA). If the Price Action resides safely above the EMA, ignore overbought sell signals entirely. Instead, use any pullback where the silver line dips into oversold territory and returns to a green histogram as a high-probability trigger to scale back into the primary trend.
8 Downloads
Last Update:
May 19, 2026 01:48 AM
Published:
Jan 19, 2026 20:44 PM
Category: