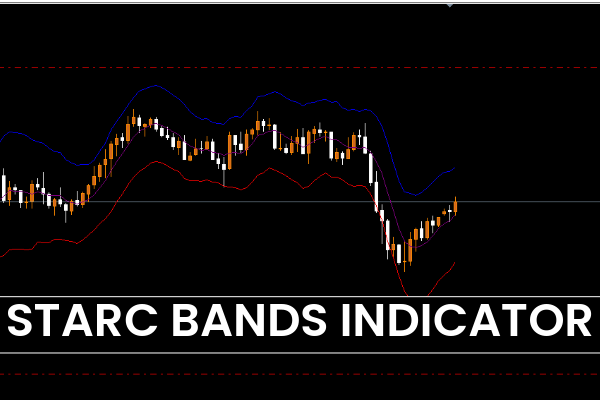
The Starc (Stoller Average Range Channels) Bands Indicator for MetaTrader 4 (MT4) is a powerful technical tool designed to identify potential trend reversals and high-probability trade entries. Similar in concept to the Bollinger Bands, this indicator encloses price within dynamic upper and lower boundaries, helping traders anticipate overbought and oversold conditions.
The Starc Bands Indicator is composed of three key components — an upper band, a middle band (Simple Moving Average), and a lower band. The Average True Range (ATR) is used to calculate the upper and lower limits by adding and subtracting the ATR value from the SMA. This combination creates a responsive price channel that adapts to volatility.
How the Starc Bands Indicator Works
At its core, the SMA (Simple Moving Average) defines the market’s general direction, while the ATR (Average True Range) measures volatility.
The upper band is created by adding ATR to the SMA.
The lower band is created by subtracting ATR from the SMA.
When market volatility increases, the bands expand, indicating stronger momentum or possible breakout conditions. When volatility decreases, the bands contract, signaling consolidation or possible trend exhaustion.
This structure provides traders with a visual framework for spotting price extremes — areas where price may be ready to reverse or retrace.
How to Trade Using the Starc Bands Indicator for MT4
Buy Signal (Long Entry)
Wait for price to touch or slightly break below the lower band.
Look for rejection wicks or bullish reversal candles (e.g., hammer or engulfing).
Confirm that the next candle closes bullish (green).
Enter a BUY trade and target the middle or upper band for profit.
This setup suggests that the market has reached an oversold level and may soon rebound upward.
Sell Signal (Short Entry)
Wait for price to touch or slightly break above the upper band.
Look for wick rejection to the downside or bearish candlestick confirmation.
Enter a SELL position once the next candle closes bearish (red).
Set a stop-loss above the upper band and target the mid-band or lower band for exit.
This setup indicates an overbought market condition and potential reversal to the downside.
Best Practices for Trading with Starc Bands
Combine with Price Action or support/resistance zones for higher accuracy.
Avoid trading during low-volatility sessions, as the signals may be weaker.
Use higher timeframes (H1, H4, Daily) for more reliable trend reversals.
Always confirm entries with additional indicators like RSI, MACD, or Moving Averages.
Because the Starc Bands react dynamically to market volatility, they help traders identify optimal trade entries, exits, and potential breakout zones. Both new and experienced traders can easily interpret and use this indicator effectively.
Conclusion
The Starc Bands Indicator for MT4 is an exceptional trading tool for identifying trend reversals, volatility zones, and overbought/oversold conditions. By combining the power of the SMA and ATR, it helps traders make more informed trading decisions with visual clarity.
Whether you are a scalper, day trader, or swing trader, the Starc Bands Indicator can significantly enhance your market timing and overall profitability. The best part — it’s free to download and easy to install on your MT4 platform.
FAQ
2 Downloads
Published:
Nov 07, 2025 02:26 AM
Category: