Mastering Trend Resumption: The Three Four Continuation Pattern Indicator
In the financial markets, price rarely moves in a single, straight line. Even the most aggressive institutional trends are characterized by a rhythmic cycle of expansion and temporary contraction. For swing traders and trend-followers, the core challenge is distinguishing a minor counter-trend consolidation from a complete market reversal. The Three Four Continuation Pattern Indicator solves this structural dilemma by automatically scanning multi-timeframe Price Action to identify highly reliable trend-resumption setups.
Here is a technical deep dive into how this powerful pattern operates and how it optimizes your market entries.
Understanding Continuation Anatomy
A continuation pattern forms when a market takes a brief "breather" after a strong directional push, allowing institutional participants to build fresh liquidity before driving price further in the original direction. The "Three Four" model specifically tracks a structured sequence of three to four corrective, counter-trend candles that fail to break major structural support or resistance.
Once this brief consolidation phase exhausts itself, a powerful breakout candle signals that the dominant trend has resumed. Tracking this manually across multiple charts and pairs is incredibly intensive; this indicator automates the process by instantly highlighting these critical pivot zones.
Analyzing the Multi-Timeframe Structure
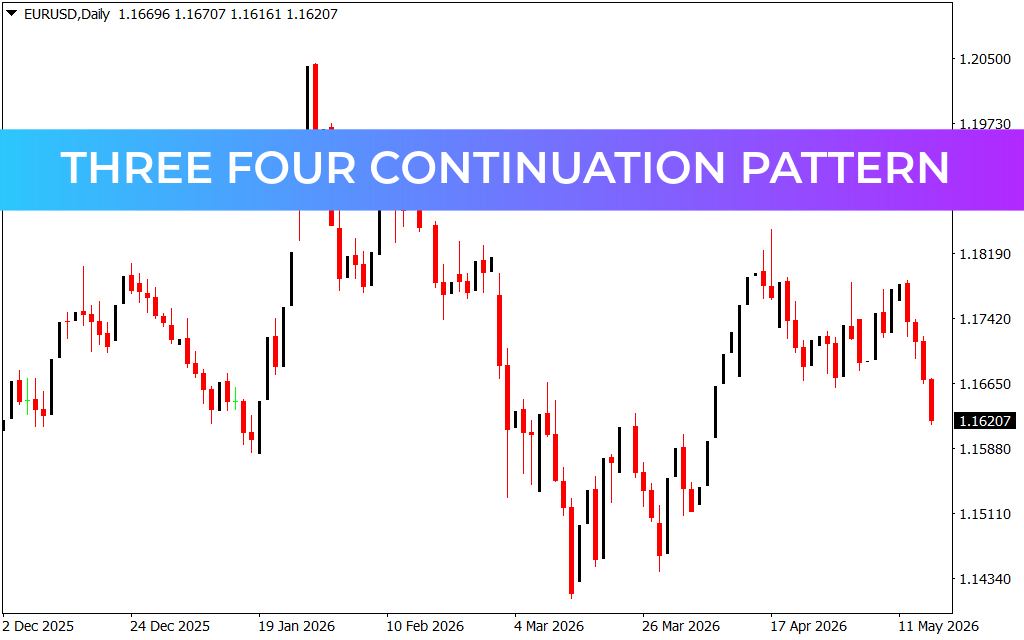
To trade continuation patterns with high mathematical probability, a trader must maintain structural perspective. As showcased across the provided chart suite—spanning the EUR/USD Daily, M15, and M5 timeframes—the indicator helps you align lower-timeframe execution with higher-timeframe order flow:
- The Daily Trend Anchor: Looking at the EUR/USD Daily chart, the market displays clear, macroeconomic structural swings. A strong continuation pattern on this timeframe indicates a long-term trend resumption that can yield hundreds of pips.
- Intraday Confluence (M15 & M5): When a daily trend is strongly bearish, the M15 and M5 charts experience temporary upward pullbacks. The Three Four Continuation Indicator scans these lower timeframes to find the exact moment the micro-pullback stalls out, mapping precise horizontal levels where the primary bearish momentum snaps back into place.
By waiting for the lower-timeframe charts to sync perfectly with the daily structural direction, traders can minimize their drawdown and enter trades with tight, highly efficient stop-losses.
Practical Rules for Peak Execution
To successfully integrate the Three Four Continuation Pattern into an active trading terminal, utilize these professional parameters:
- Trade in Harmony with the HTF: Only take bullish continuation signals on lower timeframes if the higher timeframe (such as the Daily or H4 chart) is structurally making higher highs and higher lows.
- Volume and Candle Confirmation: Ensure that the breakout candle exiting the three-to-four candle consolidation features an expanded range and a decisive close, confirming that institutional volume has returned to support the resumption.
- Dynamic Risk Mitigation: Set your defensive stop-loss order just beyond the structural swing high or low established by the brief consolidation pattern. This ensures an exceptional risk-to-reward ratio on every setup.
2 Downloads
Last Update:
May 17, 2026 01:44 AM
Published:
Jan 21, 2026 01:17 AM
Category: