Enhance Your Strategy with the Step RSI Indicator
The Relative Strength Index (RSI) has long been a staple in the toolkit of technical traders, prized for its ability to identify overbought and oversold market conditions. However, standard RSI oscillators can often be prone to "market noise," producing jagged movements that lead to false signals during periods of low volatility. The Step RSI Indicator is a sophisticated modification designed to smooth out these fluctuations, providing a clearer, step-like representation of market momentum.
What is the Step RSI Indicator?
The Step RSI is an advanced momentum oscillator that applies a "step" filtering algorithm to the traditional RSI calculation. By requiring the price to move by a specific minimum threshold before the indicator updates its value, it effectively eliminates minor price "jitters." This results in a cleaner visual guide that highlights significant shifts in trend rather than temporary market noise.
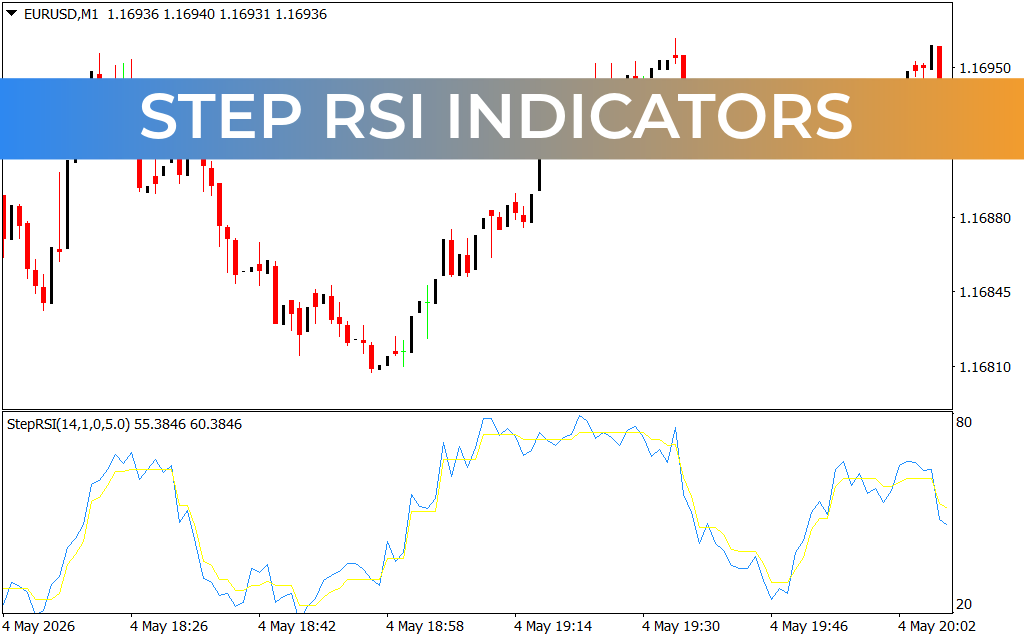
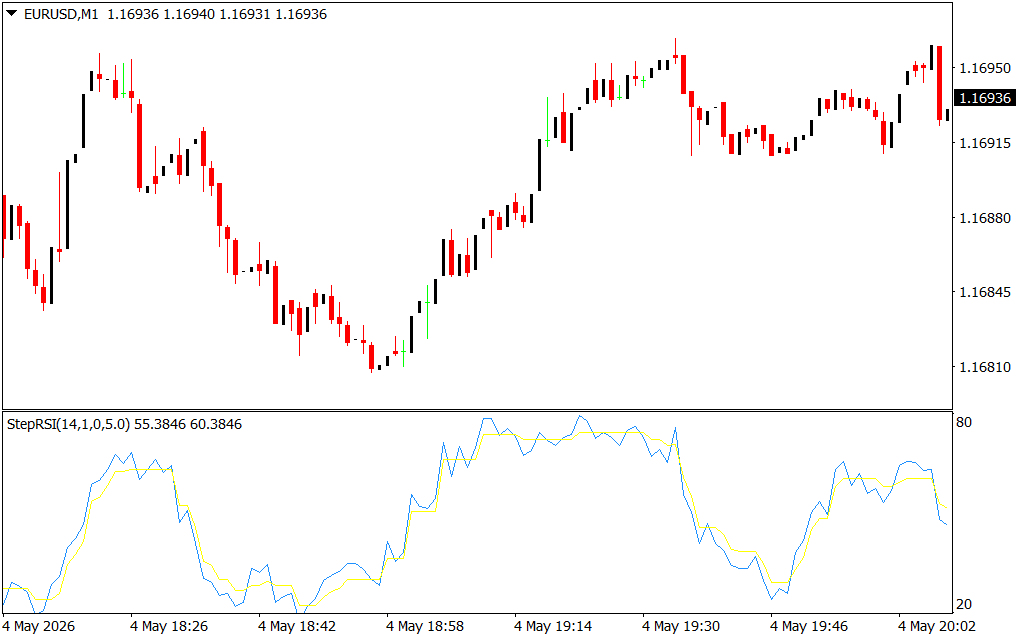
As demonstrated in the file EURUSDM1.png, the Step RSI appears in a sub-window below the price chart. It typically features two lines: a traditional RSI line (often in blue) and the "Step" filtered line (often in yellow). This dual-line approach allows traders to see the raw momentum compared against the filtered trend, making it easier to spot genuine reversals and trend continuations.
Key Features and Advantages
- Noise Reduction: The step-like movement ensures that the indicator only reacts to meaningful price changes, helping traders stay focused on the broader trend.
- Clearer Entry and Exit Points: The flat "steps" provide objective levels. When the step line breaks a flat level, it often signals a fresh burst of momentum.
- Customizable Thresholds: Traders can adjust the "step size" to suit different assets and timeframes, from fast-paced Scalping on the M1 (as seen in EURUSDM1.png) to long-term swing trading.
- Versatile Divergence Analysis: Identifying divergences between price and the Step RSI is often more reliable than with standard RSI, as the filtered steps make "higher highs" and "lower lows" much more apparent.
Strategic Trading with Step RSI
One of the most effective ways to utilize the Step RSI is by monitoring the interaction between the raw RSI and the step line. In a strong uptrend, you will often see the raw RSI leading the way while the step line provides a "floor" of support. A crossover where the raw RSI breaks back above the step line can serve as a powerful "buy" signal during pullbacks.
Additionally, the Step RSI is excellent for identifying Overbought and Oversold conditions with higher precision. Because the steps stay flat during consolidation, a breakout from these flat zones into the extreme 70/30 or 80/20 regions carries more weight than a standard oscillator spike.
Conclusion
The Step RSI Indicator is a powerful upgrade for any trader who values clarity and objective data. By filtering out the chaos of intraday volatility, it allows you to see the true "steps" the market is taking. Whether you are a Forex scalper or a crypto trend follower, integrating the Step RSI into your MetaTrader setup can significantly enhance your decision-making process.
1 Download
Last Update:
May 05, 2026 15:38 PM
Published:
Jan 27, 2026 20:19 PM
Category: