The Range Average Retest Model Indicator for MT4 is a highly strategic tool designed for traders seeking precision in range trading. By visualizing dynamic Support And Resistance levels based on historical price swings and retests, this indicator helps traders pinpoint high-probability entry and exit zones. Whether you trade Forex, indices, or commodities, this indicator is useful for both breakout and mean-reversion strategies.
Developed by LuxAlgo, the Range Average Retest Model Indicator incorporates smart features such as trade filtering, average range visualization, and automatic plotting of stop loss and take profit zones. These functionalities provide traders with a systematic and efficient approach to trading within market ranges.
How the Range Average Retest Model Indicator Works
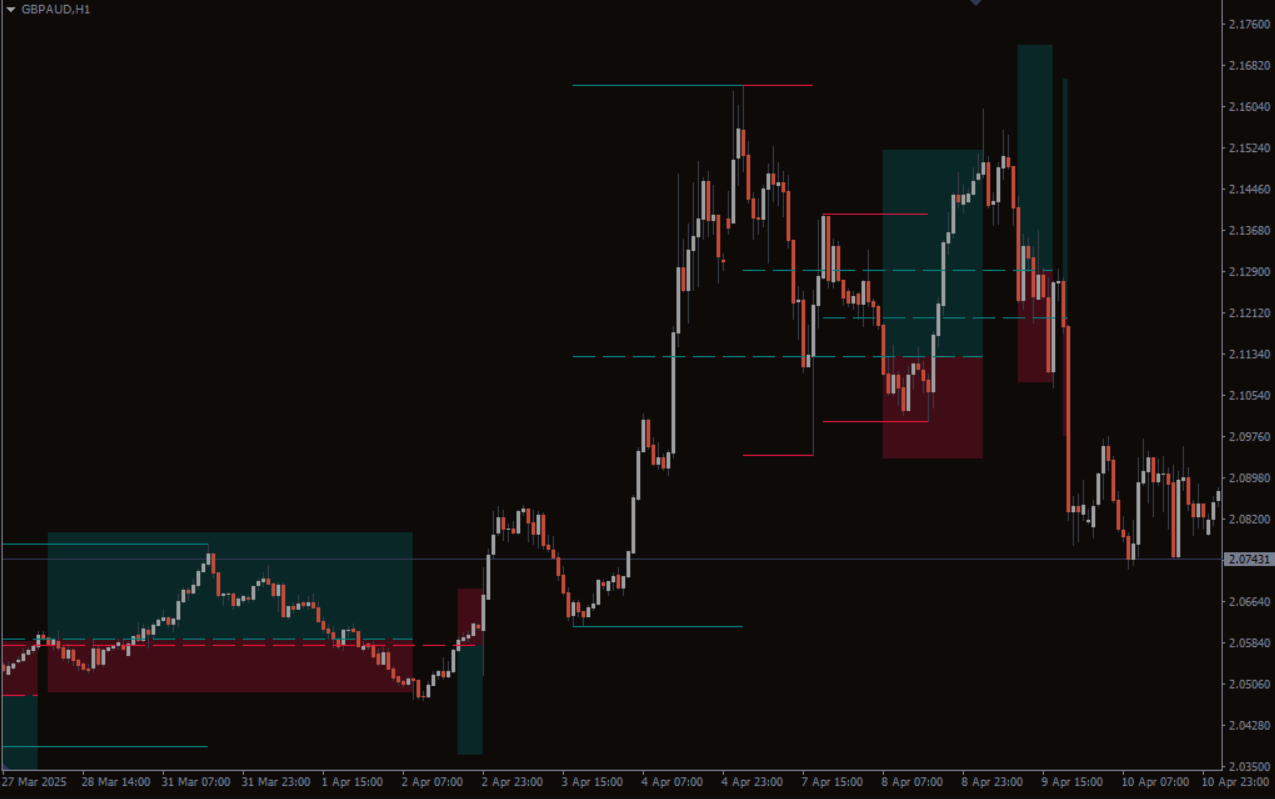
The indicator identifies historical swing points and calculates the average price range where retests are likely to occur. Once a range is defined, the tool plots the midpoint, upper, and lower bounds of the range, giving traders a clear visual guide.
Bullish Zones: Highlighted in teal, signaling potential long entries.
Bearish Zones: Highlighted in crimson, signaling potential short entries.
When the price approaches these bounds and respects the range behavior, the indicator plots a trade zone along with suggested stop loss and take profit levels. This allows traders to plan trades based on statistical price behavior rather than guesswork, improving the chances of success in both trending and ranging markets.
Trading Signals and Strategy
The Range Average Retest Model Indicator MT4 is versatile and can be applied across multiple trading styles:
Breakout Trading
When the price breaks above or below the established range, the indicator confirms whether the breakout is valid and provides potential target zones for taking profits. Traders can use these signals to enter breakout trades with higher confidence.
Mean-Reversion Trading
During range-bound markets, price often revisits average levels before reversing. The indicator’s plotted trade zones allow traders to identify optimal points for reversion trades, improving timing for entries and exits.
Stop Loss and Take Profit Placement
Automatically calculated TP and SL zones minimize risk and allow traders to set predefined targets, helping maintain disciplined risk management.
Best Practices for Using the Indicator
Combine With Trend Filters: Confirm range signals with moving averages or trend indicators for higher accuracy.
Monitor Volume: High volume during retests or breakouts can strengthen trade signals.
Adjust Timeframes: Use higher timeframes for strong range signals and lower timeframes for fine-tuning entries.
Risk Management: Always follow proper money management rules and avoid overleveraging.
By adhering to these best practices, traders can maximize the indicator’s potential and consistently identify high-probability setups.
Why Traders Prefer the Range Average Retest Model Indicator
Automatic plotting of historical and real-time ranges
Clear visual trade zones for entry, exit, TP, and SL
Supports both breakout and mean-reversion strategies
Compatible with all MT4 timeframes
Helps reduce emotional trading decisions
This combination of visual clarity and strategic precision makes the indicator an essential tool for traders who want to master range trading behavior.
Conclusion
The Range Average Retest Model Indicator for MT4 bridges the gap between systematic trading and visual clarity. By automatically plotting average ranges, support/resistance zones, and trade levels, it allows traders to identify and execute high-probability trades with confidence.
Download the Range Average Retest Model Indicator today from IndicatorForest.com and elevate your range trading strategy with precise entry and exit signals.
FAQ
5 Downloads
Published:
Dec 09, 2025 03:50 AM
Category: