Visualize Market Momentum with the Stoch Rainbow Indicator for MT4
In the fast-paced world of Forex trading, identifying the strength and direction of a trend is paramount. While a single Stochastic Oscillator is a staple for many traders, it often fails to capture the multi-layered nature of market momentum. The Stoch Rainbow indicator for MetaTrader 4 (MT4) solves this by layering multiple Stochastic lines into a single, cohesive visual tool, providing a comprehensive "rainbow" view of Price Action across various sensitivities.
What is the Stoch Rainbow Indicator?
The Stoch Rainbow is an advanced momentum oscillator that plots a series of Stochastic lines, each with slightly different parameters. This creates a ribbon-like effect that helps traders visualize market sentiment in three dimensions: direction, strength, and exhaustion. Unlike a standard oscillator that can be prone to "whipsaws," the Stoch Rainbow provides a smoother, more reliable interpretation of trend cycles.
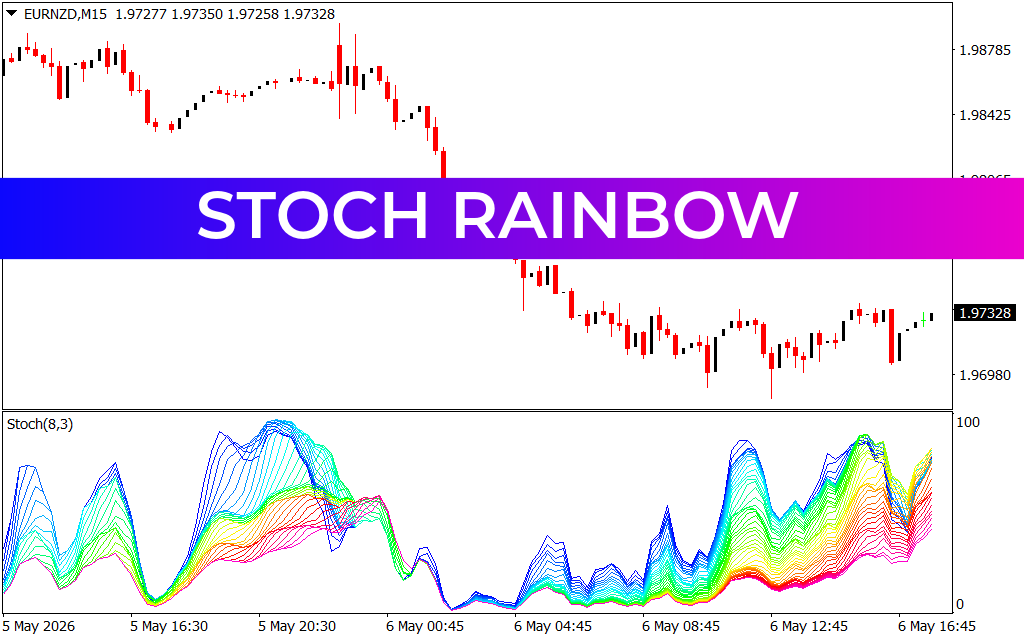
As seen in the provided chart for the EURNZD M15 timeframe, the indicator appears in a separate window below the price action. The "rainbow" of lines oscillates between 0 and 100, providing clear visual cues for overbought and oversold conditions.
Key Features and Benefits
- Multi-Layered Momentum Analysis: By using a spectrum of Stochastic lines, the indicator reveals how momentum is shifting across different time horizons simultaneously.
- Trend Strength Identification: When the rainbow is tightly compressed and moving in one direction, it confirms a strong, healthy trend. Conversely, when the lines begin to fan out or "tangle," it suggests a weakening trend or an impending reversal.
- Visual Exhaustion Zones: Extreme highs (near 100) and lows (near 0) in the Stoch Rainbow are highly accurate at pinpointing exhaustion points where the market is likely to correct or consolidate.
- Intuitive Color Coding: The transition from cool colors (blues) to warm colors (reds) provides an instant visual snapshot of market cycles, making it an excellent tool for traders managing multiple currency pairs.
Strategic Trading Applications
The most effective way to utilize the Stoch Rainbow is through Trend-Following Reversals. In the EURNZD example, notice how the entire rainbow plunges during a sharp downward move. A high-probability long entry occurs when the "cool" blue lines at the top of the rainbow begin to hook upward from the oversold zone, followed by the rest of the ribbon.
Furthermore, it is an exceptional tool for identifying Momentum Divergence. If price makes a new low but the Stoch Rainbow forms a higher low, it signals that the underlying selling pressure is evaporating. Traders often use the central 50 level as a "pivot" point—if the majority of the rainbow stays above 50, the bullish sentiment is dominant; if below, the bears are in control.
Conclusion
The Stoch Rainbow indicator is a vital asset for any MT4 trader looking to enhance their technical edge. It transforms a traditional oscillator into a high-definition momentum map, allowing you to trade with the same clarity as professional institutional participants. Whether you are Scalping the M15 or swing trading daily charts, the Stoch Rainbow provides the structural depth and real-time insights needed to thrive in today's global markets.
2 Downloads
Last Update:
May 06, 2026 20:54 PM
Published:
Jan 26, 2026 22:33 PM
Category: