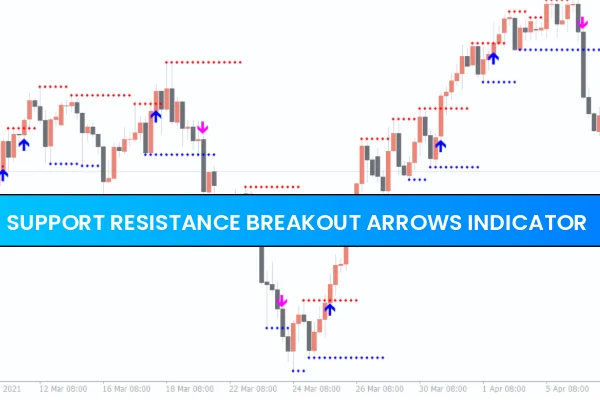
The Support Resistance Breakout Arrows Indicator for MT4 is a vital tool for forex traders, especially those using intraday breakout trading strategies. By combining Fractals, CCI, and RSI, this indicator provides highly reliable BUY and SELL arrow signals while automatically identifying major Support And Resistance levels. Its non-repaint nature ensures that traders can trust both the arrows and the support/resistance lines to make informed decisions.
How the Support Resistance Breakout Arrows Indicator Works
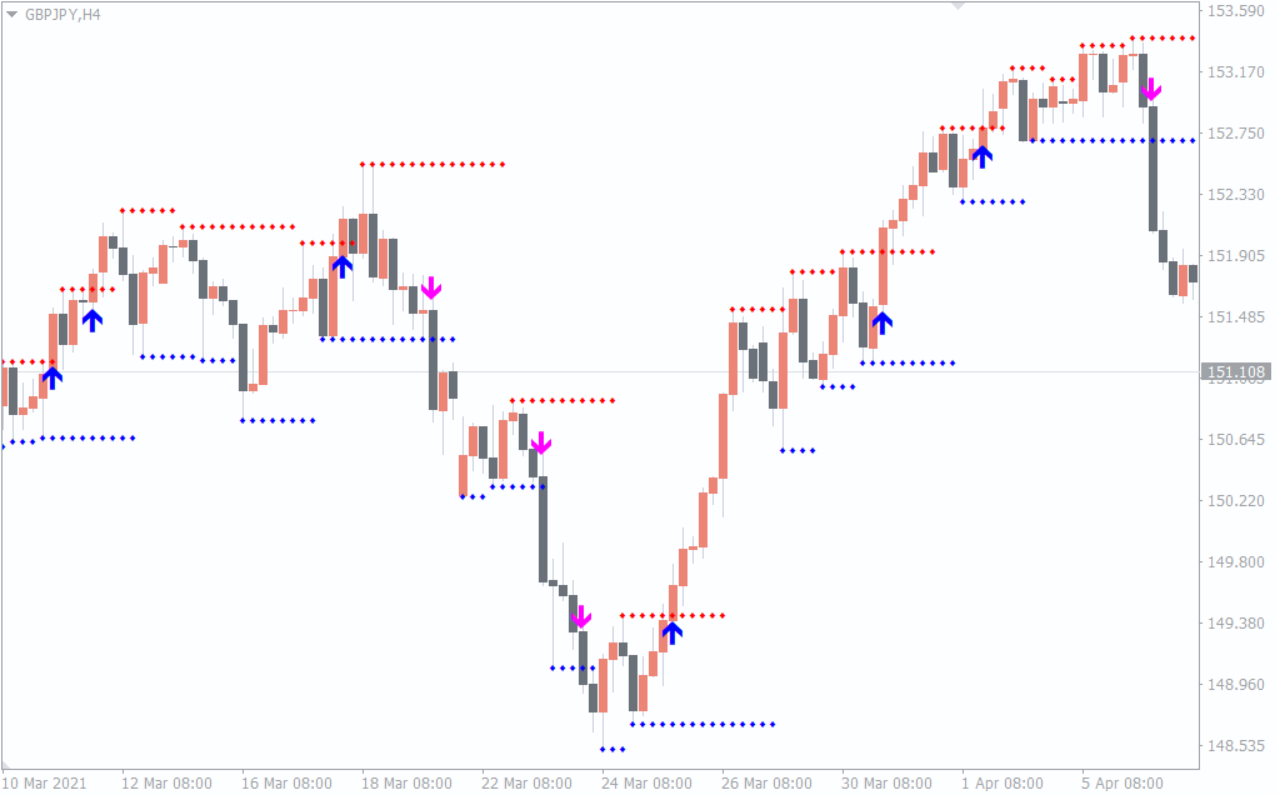
The indicator automatically scans the chart to detect strong support and resistance zones using Fractals, CCI, and RSI. Once identified, it displays BLUE arrows for BUY signals and MAGENTA arrows for SELL signals. Support levels are shown in BLUE, while resistance levels appear in RED, giving traders a clear visual representation of potential market turning points.
Trading Signals
BUY Trade: Enter when a BLUE arrow appears. Multiple BUY signals may occur during a strong trend. Exiting can be done at the appearance of a SELL signal or Trend Reversal.
SELL Trade: Enter when a MAGENTA arrow appears. Similarly, multiple SELL signals may appear in a trending market.
The indicator does not rely on pivot points; instead, it calculates optimal support and resistance levels using the combined analysis of Fractals, CCI, and RSI. Traders can also filter signals by adjusting CCI levels or overbought/oversold RSI levels for higher accuracy.
Advantages for Forex Traders
Automatic Support & Resistance Levels
New traders often struggle to identify strong Sup&Res zones manually. This indicator automatically plots major levels, reducing manual effort and allowing focus on trade execution.
Works Across All Timeframes
While ideal for intraday trading, the indicator can also be applied to H4, Daily, and Weekly charts, making it suitable for long-term traders.
Non-Repaint Signals
Both the arrow signals and Sup&Res levels remain fixed after formation, providing traders with reliable trading cues.
Multi-Timeframe Trading
Advanced traders can combine support/resistance levels with multi-timeframe analysis to add positions in the trend direction and incorporate the signals into complex strategies.
Trading Strategy Tips
Follow the Trend: Use the indicator signals in the direction of the prevailing trend for higher probability trades.
Filter Signals: Adjust CCI and RSI settings to reduce false signals during sideways markets.
Use Price Action Confirmation: Combine arrows and Sup&Res breakouts with candlestick patterns, trendlines, or chart formations to confirm trade entries.
Add Positions During Strong Trends: Traders can add to existing positions when new signals appear in the same trend direction.
Conclusion
The Support Resistance Breakout Arrows Indicator for MT4 is a powerful trading tool for forex traders of all experience levels. By automatically plotting major support and resistance zones and providing clear BUY and SELL arrow signals, the indicator simplifies breakout trading strategies. For consistent results, combine it with price action analysis, multi-timeframe confirmation, and trend-following strategies. The indicator is free to download and easy to install on MetaTrader 4.
Visit IndicatorForest.com to download this essential MT4 indicator and improve your trading strategy today.
FAQ
52 Downloads
Published:
Dec 02, 2025 04:11 AM
Category: