Mastering Momentum with the Swami RSI Indicator for MT4/MT5
In the world of fast-paced trading, timing is everything. While a standard RSI provides a single snapshot of overbought or oversold conditions, the Swami RSI offers a much more comprehensive view. By visualizing RSI values across multiple periods simultaneously, this indicator allows traders to see the "evolution" of momentum, making it an essential tool for those looking to improve their market timing and entry precision.
What is the Swami RSI?
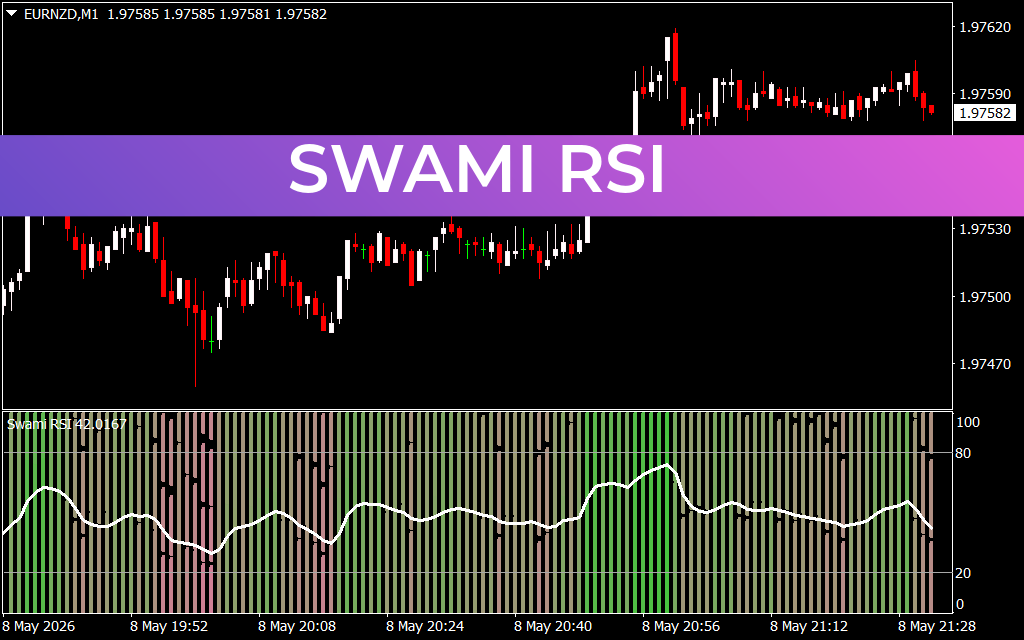
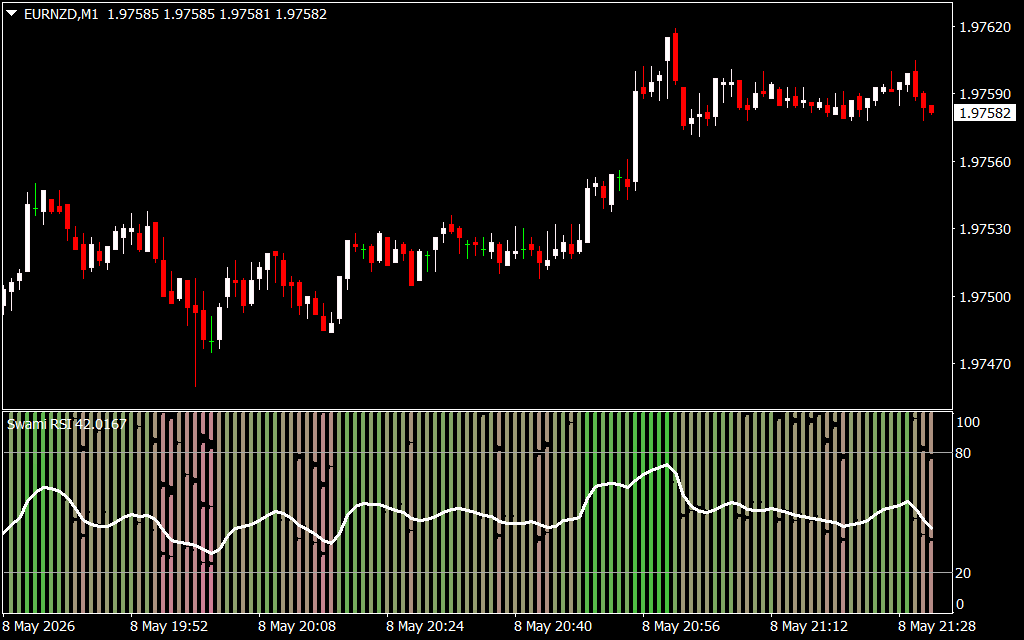
The Swami RSI is a sophisticated technical analysis tool that applies the "Swami" visualization technique to the classic Relative Strength Index. Instead of a single line oscillating between 0 and 100, the Swami RSI uses a vertical color-coded histogram or heat map. This represents the RSI readings for various periods—from short-term to long-term—all in one window.
When the bars are green, it indicates bullish momentum across several timeframes. Conversely, red or darker shades signify bearish pressure. The white line overlaid on the heat map acts as a smoothed average, providing a clear signal of the overall trend direction.
Key Features and Trading Benefits
- Multi-Period Insights: One of the greatest challenges for scalpers and day traders is the "noise" on lower timeframes. The Swami RSI filters this noise by showing if a price move is backed by momentum across broader periods.
- Visual Trend Identification: The heat map allows for instant recognition of Trend Strength. A deep, solid green block suggests a powerful upward surge, while fading colors indicate that the momentum is losing steam.
- Reduced Lag: By combining multiple RSI calculations, the Swami version often identifies reversals and breakouts faster than a traditional single-period RSI, which can be prone to "hanging" in overbought territory during strong trends.
How to Trade with Swami RSI
Traders often use the Swami RSI to confirm entries. For example, if Price Action shows a breakout on the main chart, a trader will look at the Swami RSI for a "color flush"—where all periods align to the same color. This alignment acts as a high-probability confirmation signal. It is also an excellent tool for spotting divergences, where the price makes a new high but the Swami heat map begins to cool down or change color.
Whether you are a 1-minute scalper or a swing trader, the Swami RSI provides a deeper layer of market sentiment that standard oscillators simply cannot match.rtunities.
1 Download
Last Update:
May 09, 2026 00:33 AM
Published:
Jan 25, 2026 16:58 PM
Category: