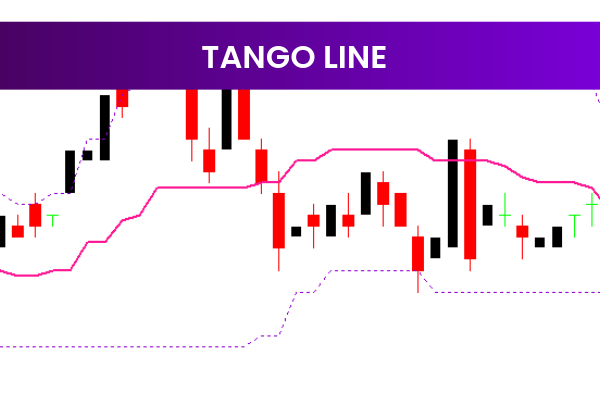
The Tango Line Indicator is a popular and practical free Forex indicator designed for the MetaTrader 4 (MT4) trading platform. It helps traders identify potential trading opportunities by providing a clear visual representation of Price Action. Thanks to its simple structure and easy interpretation, this indicator is widely used by traders who want to spot trends, reversals, and key price levels without complicated analysis.
Price action plays a vital role in Forex trading, and the Tango Line Indicator simplifies price behavior by smoothing market data into a single dynamic line and supporting histogram.
How the Tango Line Indicator Works
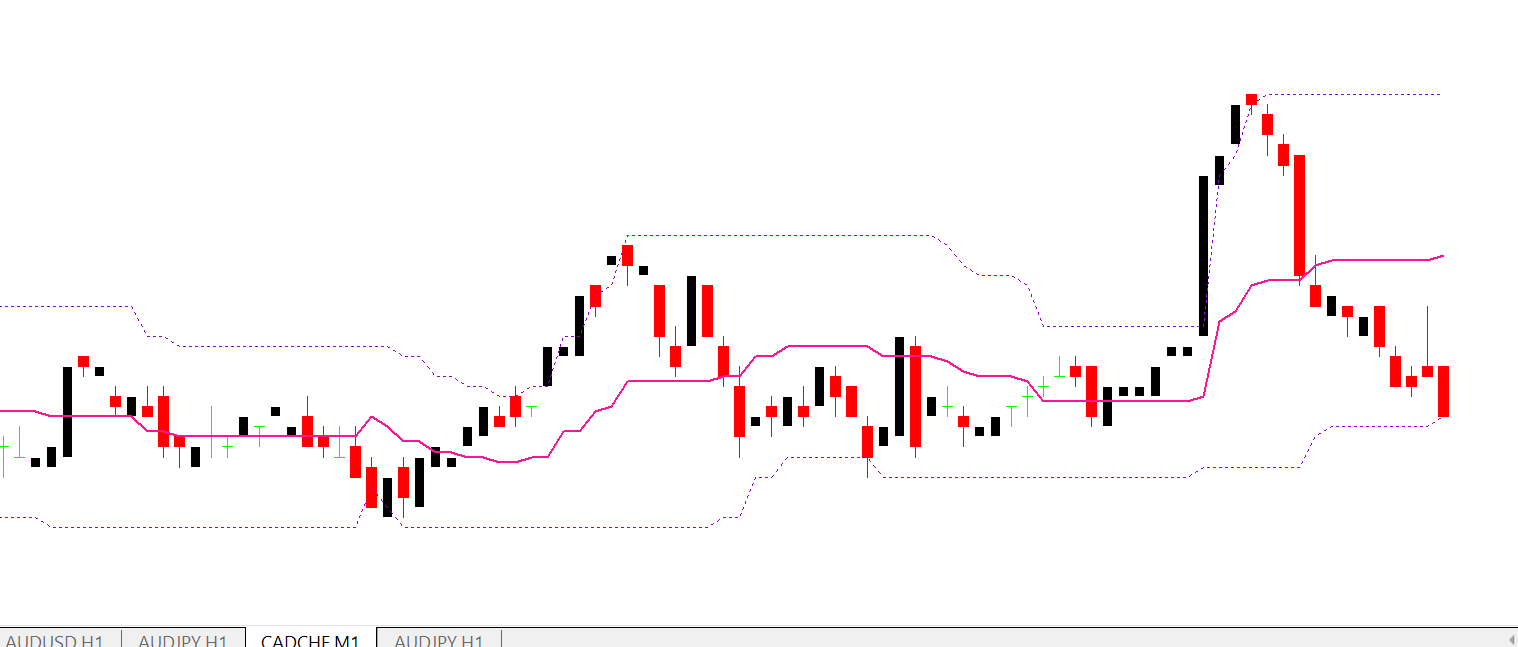
The Tango Line Indicator plots a line on the chart that closely follows price movement. This line is calculated using the average of the high and low prices of the selected currency pair, helping to smooth out short-term fluctuations and reveal the underlying price direction.
In addition to the line, the indicator displays a histogram. The histogram represents the difference between the current price and the average of the high and low prices. This visual element allows traders to quickly assess momentum and price deviation.
Interpreting the Tango Line and Histogram
When price stays above the Tango Line, it may indicate bullish market conditions. When price remains below the line, it can signal bearish momentum.
The histogram adds further insight:
Expanding histogram bars indicate increasing momentum
Contracting bars suggest weakening momentum or consolidation
By combining the line and histogram, traders gain a clearer view of both direction and strength.
Identifying Reversals and Trading Opportunities
One of the key strengths of the Tango Line Indicator is its ability to help identify potential market reversals. When price begins to cross the Tango Line and the histogram changes direction, it may signal a shift in market sentiment.
These signals can be used to:
Identify early trend reversals
Confirm pullback entries
Spot momentum changes
This makes the indicator especially useful for traders who focus on timing entries more accurately.
Support And Resistance Insight
The Tango Line often acts as a dynamic support or resistance level. Price reactions around the line can help traders identify areas where buying or selling pressure increases.
When combined with horizontal support and resistance levels, the Tango Line Indicator can improve trade confirmation and reduce false signals.
Best Trading Applications
The Tango Line Indicator can be used across all timeframes and currency pairs, making it suitable for:
Scalping strategies
Day trading setups
Swing trading opportunities
It is often combined with other indicators such as RSI, moving averages, or trendlines for additional confirmation.
Benefits of Using the Tango Line Indicator
Smooth visual representation of price action
Histogram shows momentum strength clearly
Helps identify trends and reversals
Useful for support and resistance analysis
Easy to read and beginner-friendly
Free and fully compatible with MT4
Because of its simplicity and effectiveness, the Tango Line Indicator is a valuable tool for Forex traders.
How to Install and Use
To install the Tango Line Indicator on MT4:
Download the indicator from IndicatorForest.com
Open MT4 and go to “File > Open Data Folder > MQL4 > Indicators”
Paste the indicator file into the Indicators folder
Restart MT4 and attach the indicator to your chart
Once installed, the indicator will automatically analyze price action and display signals in real time.
Why Traders Choose the Tango Line Indicator
Traders choose the Tango Line Indicator because it offers clear price action insight without cluttering the chart. It simplifies Market Structure, making it easier to identify trends, momentum shifts, and potential reversal points.
To explore more free and professional MT4 indicators, visit IndicatorForest.com and strengthen your trading strategy.
Conclusion
The Tango Line Indicator is a free, reliable, and easy-to-use Forex Indicator for MT4 traders. By combining an average-based price line with a momentum histogram, it helps traders identify trends, reversals, and potential trading opportunities with greater confidence. Download it today from IndicatorForest.com and trade price action more effectively.
1 Download
Published:
Jan 09, 2026 02:12 AM
Category: