Master Trend Trading with the Three Line Break Indicator
In technical financial analysis, time-based charting formats like standard Japanese candlesticks often introduce unwanted market noise. A single high-volatility spike or a brief counter-trend consolidation block can trick a trader into exiting a profitable position prematurely or misidentifying a market structural shift. To combat this common pitfall, professional traders utilize price-filtered charting systems. The Three Line Break indicator is one of the most powerful tools available for this purpose, filtering out irrelevant price fluctuations to clarify macro market direction.
What is the Three Line Break Indicator?
Originating in Japan, the Three Line Break method is a charting technique that focuses exclusively on asset price changes while completely disregarding the element of time. Traditional Western indicators calculate values based on fixed intervals (such as 1-minute or 4-hour candles), but a Three Line Break chart only constructs a new block when the market makes a significant structural move.
The indicator gets its name from its strict reversal rule. While it easily plots continuous lines in the direction of an established trend, it requires the closing price to break past the extreme highs or lows of the previous three consecutive lines to validate a structural Trend Reversal. By forcing the market to prove its directional strength mathematically, this tool filters out typical intraday whipsaws, giving trend followers and swing traders a reliable compass for major trends.
Interpreting the Algorithmic Signals
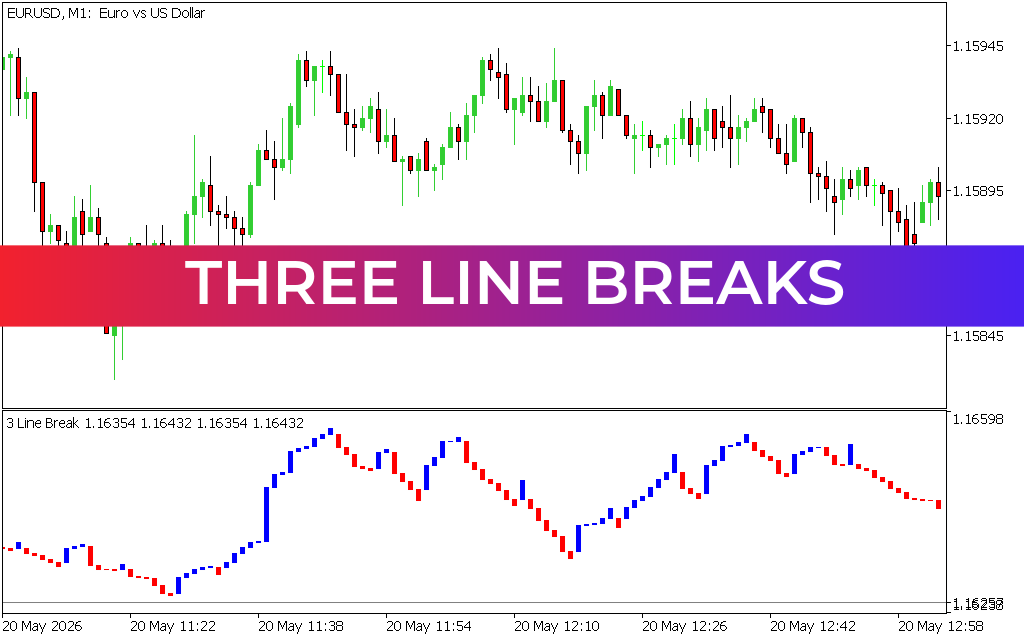
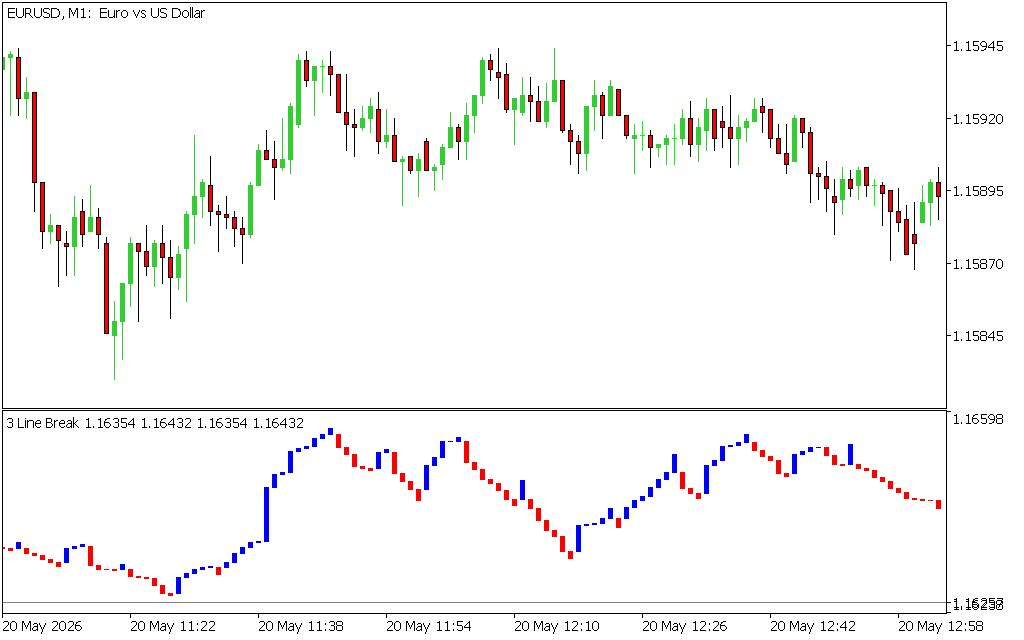
When applied to highly liquid financial markets like the EUR/USD pair, the Three Line Break indicator operates efficiently in a separate sub-window beneath the main candlestick grid. The interface constructs highly responsive vertical blocks:
- Bullish Expansion (Blue Blocks): When the indicator prints solid blue bars, it signals that the buyers are in control and the market is making consecutive higher highs. Traders can use these expanding blocks to ride the broader momentum confidently without getting shaken out by minor intraday noise.
- Bearish Distribution (Red Blocks): Conversely, a series of red blocks highlights a dominant markdown phase driven by aggressive selling pressure. In this environment, short-selling structures carry the highest probability of success.
- Structural Reversal Points: A sudden color change from blue to red or red to blue marks a verified line break setup. This occurs precisely when institutional volume drives a close beyond the three-bar boundary, alerting technical analysts to an impending trend shift.
Professional Tactical Strategies
To gain a clear trading edge with the Three Line Break indicator, consider implementing these rule-based execution parameters:
- The Breakout Entry System: Wait for a long-standing consolidation range to break. Enter a position immediately upon the closing print of the very first reversal block (e.g., buying the first blue block after a string of red blocks), using the opposite side of the structural line break pattern as your protective stop-loss.
- Trend Continuation Support: Pair the indicator with a long-term exponential moving average (EMA) on the main chart. If the price is trading above the EMA, ignore temporary red blocks and wait to add to long positions when the indicator flashes a fresh blue bar.
By stripping away the illusion of time, the Three Line Break indicator streamlines your chart reading and instills the discipline needed to capture macro market trends cleanly.
1 Download
Last Update:
May 21, 2026 02:50 AM
Published:
Jan 18, 2026 13:37 PM
Category: