Harnessing Multi-Timeframe Trends with the Tick Watcher Dashboard
In the fast-paced world of Forex trading, making decisions based on a single timeframe is like driving a car while only looking at the front tires. Professional traders know that the secret to high-probability setups lies in multi-timeframe analysis. However, constantly flipping between charts can lead to analysis paralysis. Enter the Tick Watcher Dashboard, a powerful Metatrader indicator designed to streamline your trading by consolidating multi-timeframe data into a single, intuitive interface.
The Challenge of Multi-Timeframe Trading
To successfully trade pairs like EURUSD, GBPUSD, or USDCAD, you need to understand both the immediate Price Action and the broader market context. A bullish signal on a 1-minute (M1) chart can quickly turn into a losing trade if it runs directly into a massive resistance level on a daily (D1) or weekly (W1) chart.
Manually tracking the Average Directional Index (ADX) and Heiken Ashi Smoothed (HAS) values across four or five different timeframes for multiple currency pairs is exhausting. By the time you spot a alignment, the market has often already moved.
How Tick Watcher Synthesizes Market Data
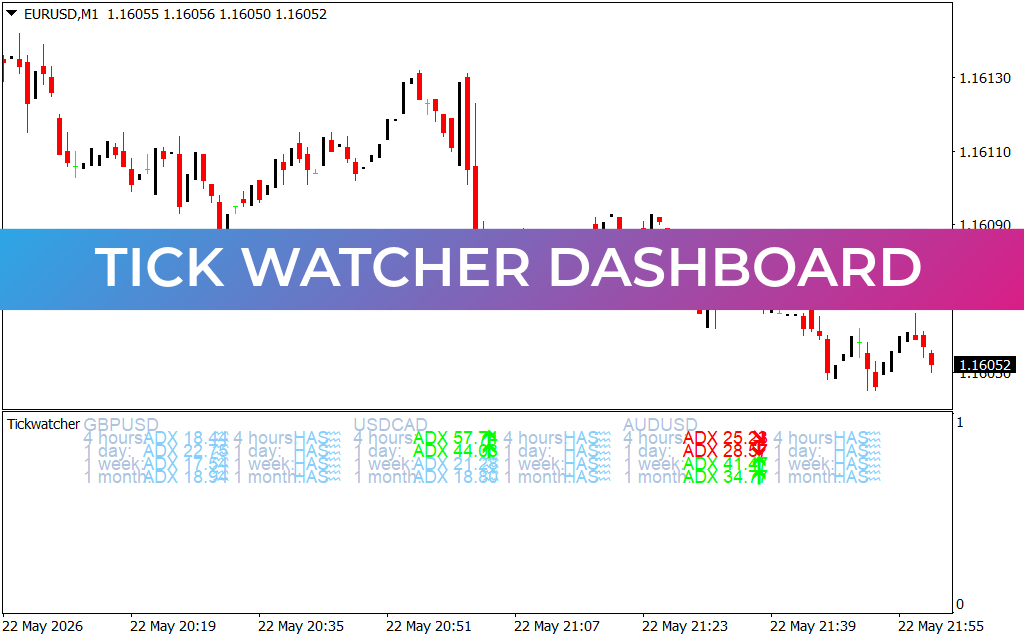
The Tick Watcher Dashboard solves this problem by acting as a command center at the bottom of your trading screen. It continuously monitors and displays crucial Trend Strength and momentum metrics across various time horizons, including:
- 4-Hour (H4)
- Daily (D1)
- Weekly (W1)
- Monthly (MN)
Dual-Indicator Logic: ADX and HAS
Instead of relying on a single technical indicator, Tick Watcher pairs the ADX (Average Directional Index) with Heiken Ashi Smoothed (HAS) values.
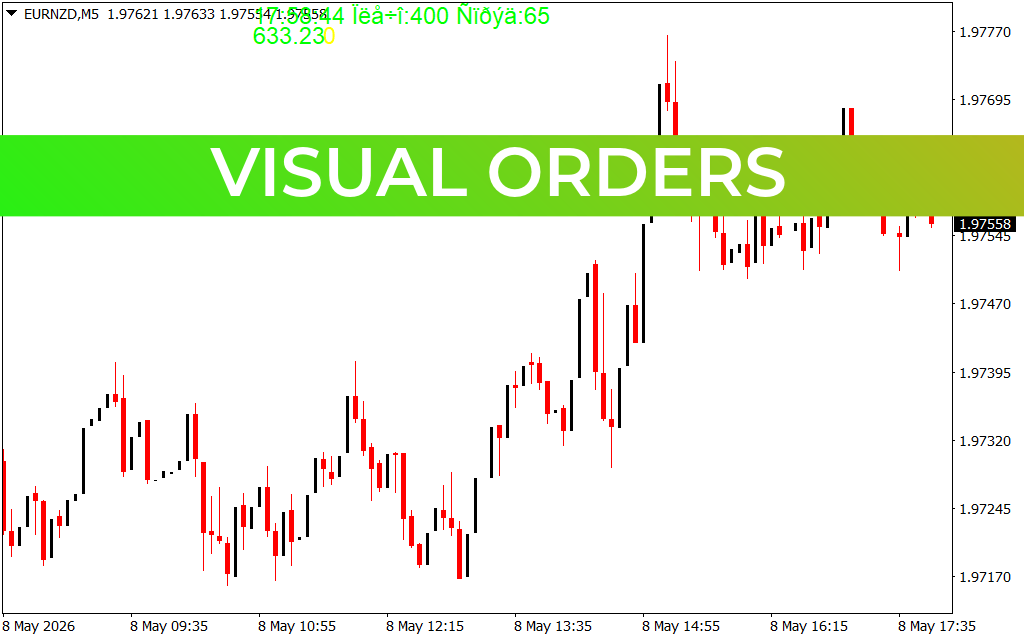
The ADX measures the overall strength of a trend, regardless of direction. When the dashboard displays a high, bright green ADX value (such as the $57.74$ or $44.03$ seen on USDCAD in the image), it signals an incredibly strong, active trend. Conversely, red values caution you that a trend might be overextended or reversing.
By pairing this trend strength with the smoothed trend-following capabilities of Heiken Ashi, the dashboard filters out market noise, allowing you to catch major macro shifts right from your execution chart.
Optimizing Your Trading Workflow
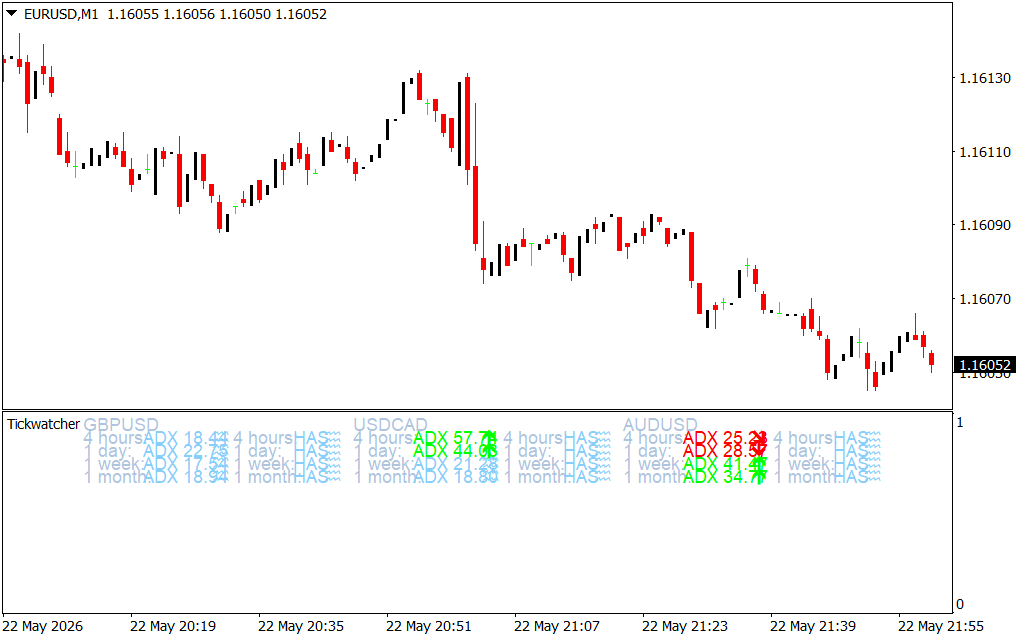
The primary benefit of the Tick Watcher Dashboard is chart cleanliness. As seen on the EURUSD M1 chart, your main window remains entirely clutter-free. You can focus purely on raw price action, candlestick patterns, or Support And Resistance levels without a messy web of moving averages blocking your view.
Whenever a potential trade setup appears on your execution timeframe, a quick glance down at the dashboard tells you if the macro players are on your side. If you are looking to short EURUSD and the dashboard shows dominant bearish or weakening metrics across the higher timeframes, your probability of success increases dramatically.
Conclusion
The Tick Watcher Dashboard is an essential tool for scalpers and day traders who want institutional-grade market awareness without the screen clutter. By cleanly organizing complex ADX and HAS data across multiple timeframes, it empowers you to trade with the wind at your back.
1 Download
Last Update:
May 24, 2026 01:50 AM
Published:
Jan 15, 2026 20:33 PM
Category: