The Ticker Trail CD Indicator is a useful and popular Forex Indicator developed for the MetaTrader 4 (MT4) trading platform. It is completely free to download and easy to use, making it a valuable addition to any trader’s technical analysis toolkit. This indicator is designed to help traders visualize Price Action, identify trend direction, and locate potential Support And Resistance levels directly on the chart.
By displaying a dynamic trail that follows price movement, the Ticker Trail CD Indicator simplifies market analysis and allows traders to make faster and more confident trading decisions.
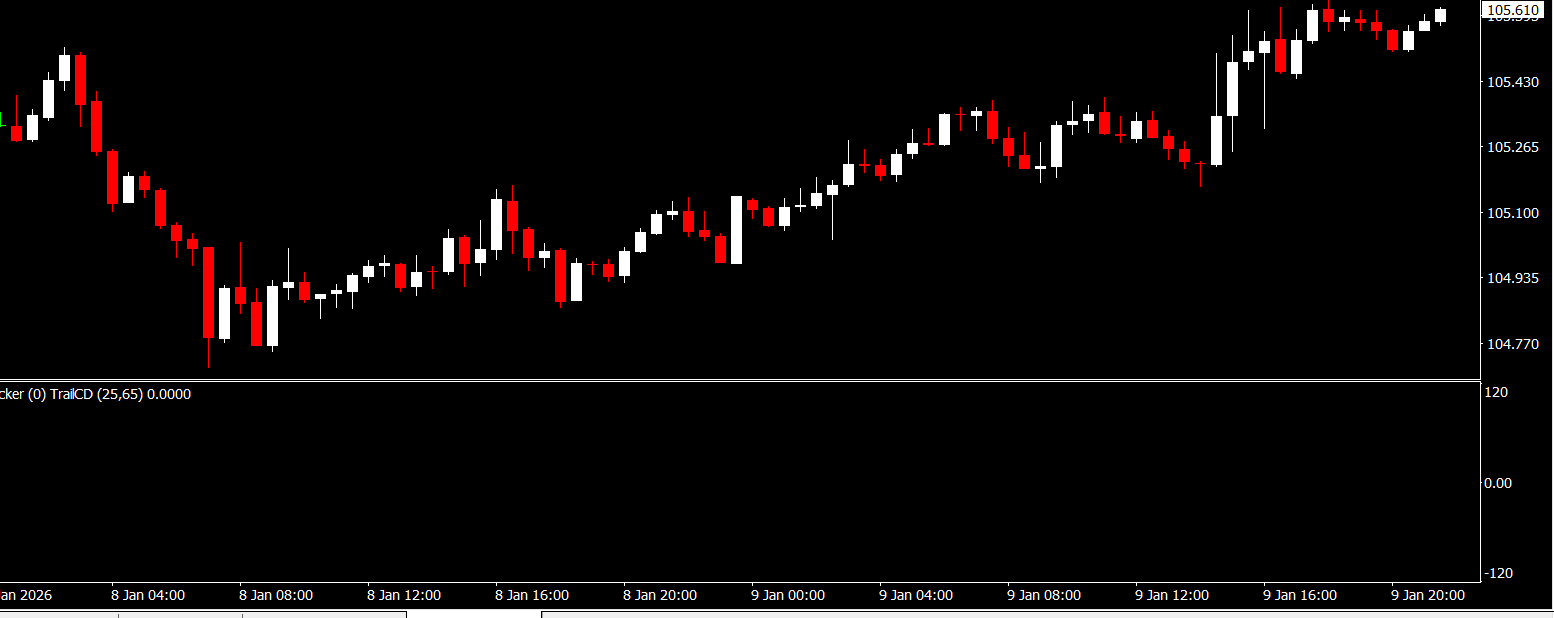
How the Ticker Trail CD Indicator Works
The Ticker Trail CD Indicator works by plotting a trailing line that closely follows price action. This line adapts to market movement and changes color based on the prevailing trend direction.
A blue line indicates an upward trend
A red line indicates a downward trend
This color-changing trail provides a clear visual representation of whether buyers or sellers are in control of the market.
Identifying Trend Direction
One of the main strengths of the Ticker Trail CD Indicator is its ability to clearly define trend direction. When the trail remains consistently blue, it suggests bullish market conditions. When it stays red, bearish momentum is dominant.
Traders often use this feature to avoid trading against the trend, which can significantly reduce unnecessary losses and false signals.
Entry and Exit Signals
The Ticker Trail CD Indicator can be used to identify potential entry and exit points for trades.
Buy Opportunities
A potential buy setup may appear when the trail changes from red to blue, indicating a possible shift from bearish to bullish momentum. This can be used as a confirmation signal when combined with other technical tools.
Sell Opportunities
A sell signal may occur when the trail changes from blue to red, suggesting that bullish momentum is weakening and sellers are gaining control.
These signals are most effective when aligned with higher-timeframe trends or key price levels.
Support and Resistance Levels
Another important use of the Ticker Trail CD Indicator is identifying dynamic support and resistance areas. The trailing line often acts as a support level in an uptrend and a resistance level in a downtrend.
Traders can use these levels to:
Place stop-loss orders
Identify pullback opportunities
Confirm breakout or reversal zones
Overbought and Oversold Conditions
The indicator can also help traders spot potential overbought and oversold conditions. When price moves far away from the trailing line, it may signal market exhaustion and a possible correction or reversal.
This makes the Ticker Trail CD Indicator useful not only for trend trading but also for short-term reversal strategies.
Best Trading Practices
While the Ticker Trail CD Indicator is effective on its own, it performs best when combined with other analysis techniques such as price action, candlestick patterns, or momentum indicators. It can be used across multiple timeframes and is suitable for Scalping, day trading, and swing trading.
As always, proper risk management and confirmation from additional tools are essential for consistent trading results.
Why Choose IndicatorForest.com
At IndicatorForest.com, traders can access high-quality free MT4 indicators, clear explanations, and practical trading resources. Each indicator is carefully selected to help traders improve their technical analysis and trading confidence.
👉 Visit IndicatorForest.com today to explore more powerful Forex indicators and trading tools for MetaTrader 4.
1 Download
Published:
Jan 11, 2026 21:34 PM
Category: