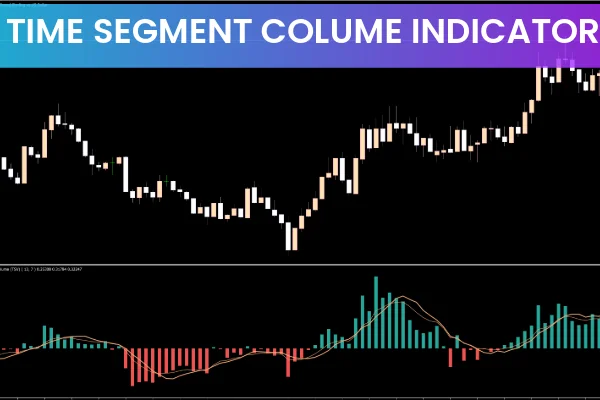
The Time Segmented Volume (TSV) Indicator for MT5 is a volume-momentum tool designed to identify whether real buying or selling pressure is driving the market. Unlike many classic oscillators that rely solely on price, TSV evaluates how volume behaves during each price segment. This makes it especially effective for spotting early momentum before price fully reacts.
TSV is widely used by traders who want to detect smart-money accumulation, trend continuation strength, and genuine breakout momentum. Because it plots volume-driven pressure around a zero line, the indicator can serve as both a trend filter and an entry confirmation tool.
When applied to higher timeframes such as H1 and H4, TSV becomes even more reliable. In these structures, volume patterns are smoother and more meaningful, helping traders distinguish between weak corrections and true trend continuation phases.
Why Traders Use TSV
Traders value TSV because it exposes moments when volume supports price direction. This often reveals strength or weakness earlier than price-only indicators.
Benefits include:
Clear identification of bullish and bearish volume pressure
Early detection of momentum shifts
Confirmation for breakouts, pullbacks, and reversals
Effective filtering of weak market conditions
Strong reliability on intraday and swing timeframes
Many traders, including myself, notice that TSV provides confidence to hold winning trades longer when volume continues to support the movement.
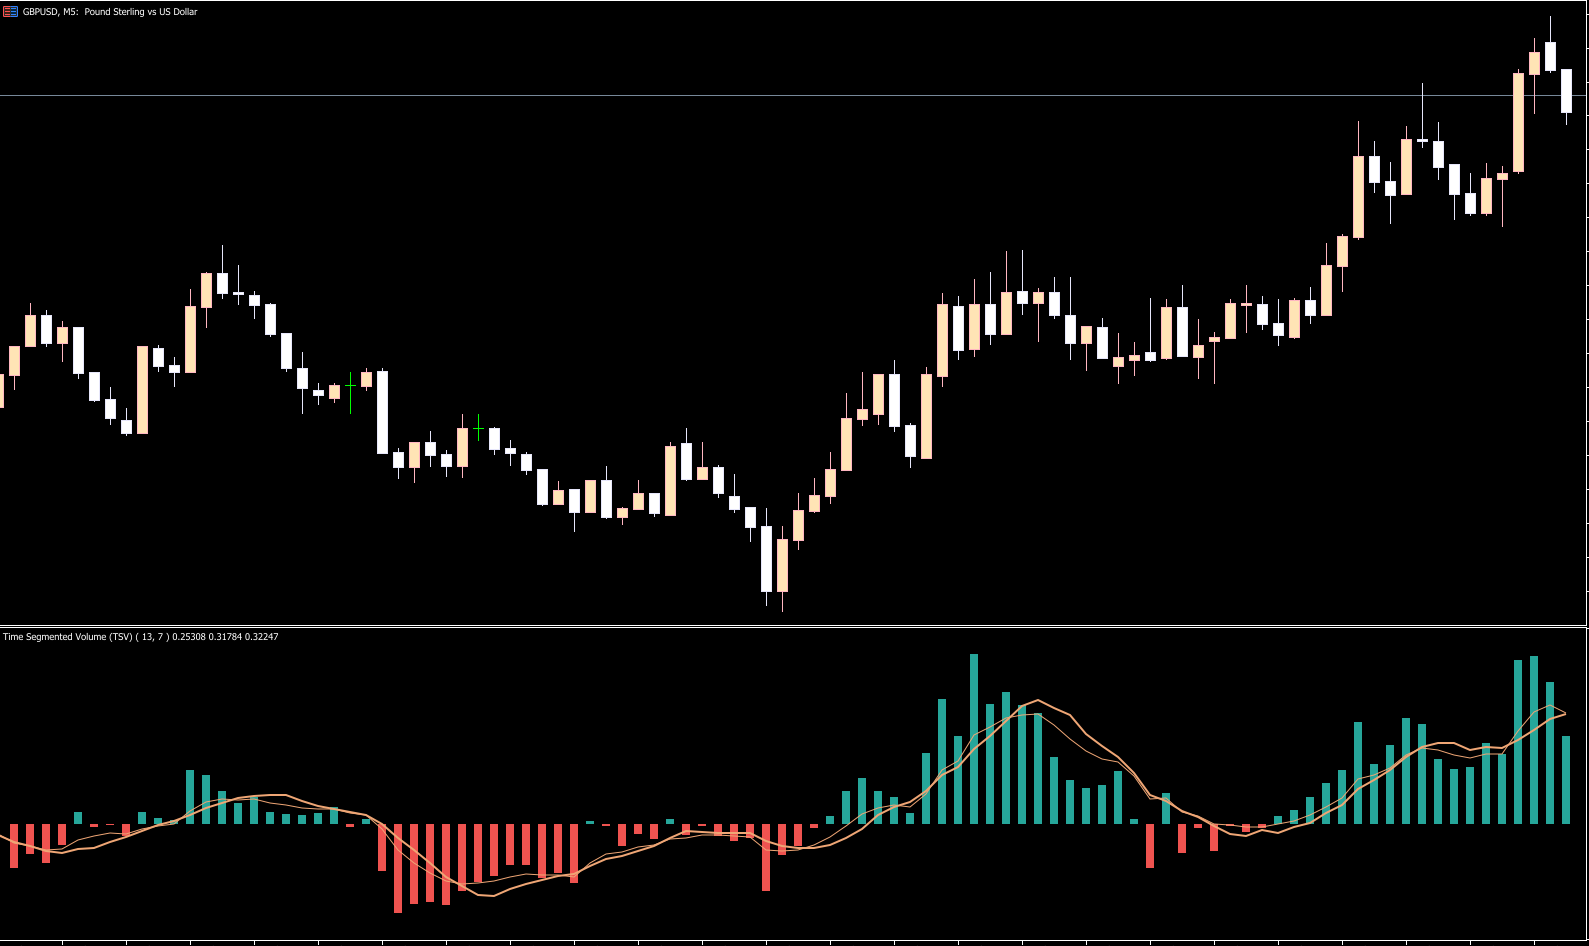
Time Segmented Volume Indicator for MT5 – Trading Signals
TSV works as a histogram oscillator plotted above and below the zero line. The direction, height, and slope of the histogram determine the strength of volume flow.
Bullish Signals
A bullish signal forms when:
The histogram rises above the zero line
The bars continue climbing, showing increasing buying pressure
This often confirms:
Breakouts with real participation
Strong impulsive bullish waves
Trend continuation after a pullback
A sharp upward spike signals aggressive buying from smart money, while a gradual rise indicates steady accumulation.
Bearish Signals
A bearish signal appears when:
The histogram drops below zero
Selling pressure increases as the histogram extends lower
This confirms:
Bearish impulses with strong seller dominance
Breakdown continuation
Rejections near resistance
Sharp drops indicate aggressive selling, while flattening near zero suggests fading momentum.
Momentum Weakness
When the histogram flattens near the zero line, it warns of:
Market indecision
Weakening trends
Potential consolidation zones
Higher risk of false breakouts
Combining TSV with price structure — such as breakouts, pullbacks, or supply/demand zones — significantly increases its accuracy.
Conclusion
The Time Segmented Volume Indicator for MT5 is a practical and intuitive tool for understanding the real strength behind market moves. By revealing whether buyers or sellers truly support a trend, TSV helps traders refine entries, exits, and breakout decisions. It is especially useful when paired with trend-following systems or breakout strategies where volume confirmation is essential.
Whether you're a day trader or swing trader, TSV provides a clean and reliable way to interpret smart-money activity — offering a genuine edge in both trending and volatile markets.
FAQ
7 Downloads
Published:
Dec 03, 2025 00:34 AM
Category: