Navigate Market Cycles Effectively with the Trendless AG Indicator
Identifying the exact structural state of financial markets is one of the greatest challenges day traders and swing analysts face. Trading systems optimized for strong, linear market expansions yield significant losses when Price Action begins consolidating. Conversely, range-bound strategies get crushed when an asset enters an intensive breakout phase. For liquid currency pairs like the EUR/USD, understanding when a macro trend has temporarily paused is essential to protecting your capital. The Trendless AG indicator addresses this technical dilemma by isolating hidden cyclic overbought and oversold states.
What is the Trendless AG Indicator?
The Trendless AG indicator is a sophisticated technical analysis oscillator engineered for modern MetaTrader platforms. It operates based on the advanced concepts of detrended price analysis.
Traditional momentum oscillators, such as standard moving averages or basic trendlines, naturally struggle to isolate short-term cycles because macro price movements distort their baselines. The Trendless AG software solves this problem by mathematically removing longer-term price trends (detrending) from current data. By stripping away the structural macro direction, the indicator isolates localized price cycles, enabling traders to accurately pinpoint intermediate overbought thresholds and oversold floors that are completely invisible on standard charts.
Key Structural Features and Analytical Benefits
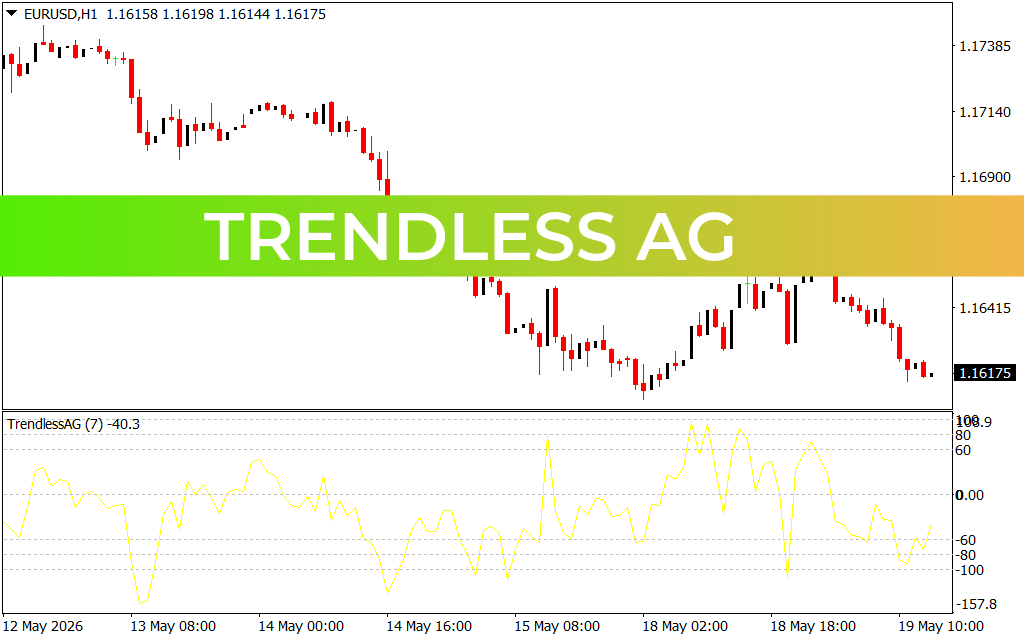
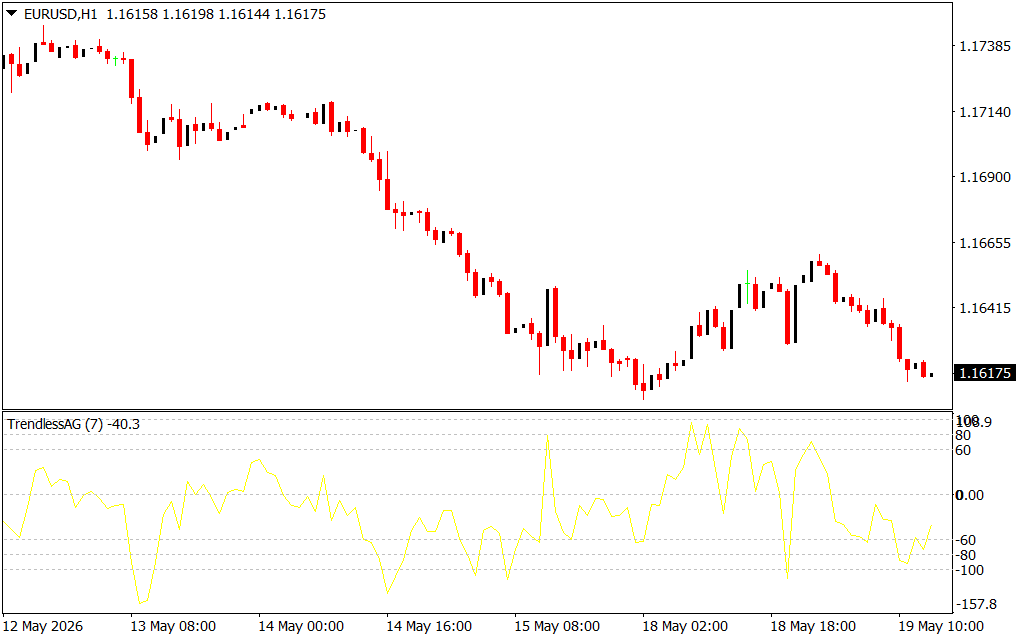
- Dynamic Equilibrium Axis: The indicator moves continuously around a fixed 0.00 center line. When the signal line oscillates near this midpoint, it confirms that macro trend pressure has faded, leaving a highly predictable trading range.
- Precise Cyclical Thresholds: The sub-window panel features clear upper and lower horizontal boundaries (such as the 60, 80, and -60, -80 levels). These serve as objective markers for tracking momentum exhaustion.
- Optimized for Swing Inflexions: As displayed across liquid operational intervals like the 1-hour (H1) chart, the oscillator's mathematical path changes directions cleanly right as intraday price expansions run out of volume.
- Clutter-Free Main Chart Design: Running the entire computational matrix inside a dedicated lower panel keeps your main screen clear, allowing you to focus entirely on organic candlestick structures, support/resistance floors, and volume blocks.
How to Trade with the Trendless AG Indicator
Trading effectively with this specialized tool centers on exploiting structural mean-reversion rejections at extreme oscillator thresholds.
- Short Entry Configuration (Overbought Reversal): When the asset climbs into a known horizontal resistance zone, monitor the Trendless AG sub-window. If the line pierces into the upper extreme overbought territory (above 60.00) and then hooks cleanly downward, a cyclical top is confirmed. Execute a short position to target the 0.00 centerline.
- Long Entry Configuration (Oversold Bounce): Conversely, if price action drops aggressively into a structural demand block while the oscillator slides below the lower boundary (under -60.00), a short-term bottom is developing. Wait for the signal line to turn back upward before executing a long position to ride the corrective wave.
Take total control of volatile market transitions by downloading the Trendless AG indicator today to trade with systematic clarity.
1 Download
Last Update:
May 19, 2026 17:06 PM
Published:
Jan 19, 2026 19:28 PM
Category: