The True Fractal Band MTF Indicator for MT4 is a powerful tool designed to help traders identify potential market trends and reversals. Featuring green and red fractal arrows, this indicator visually signals buying and selling opportunities. The green arrow indicates a potential buy, while the red arrow shows a potential sell.
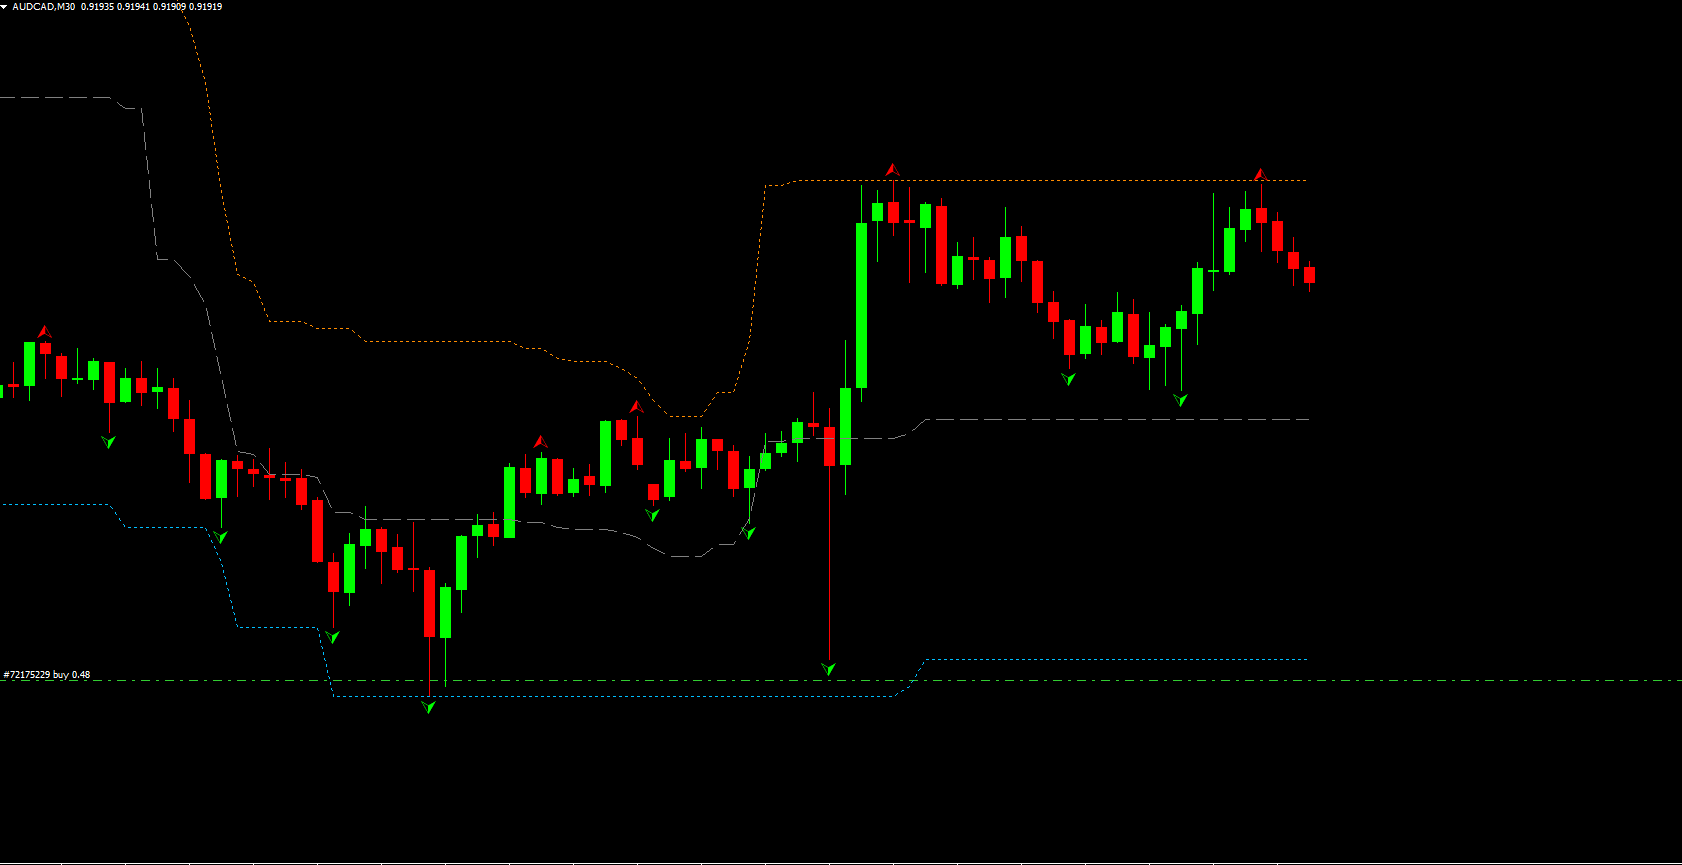
The price remains wrapped by the indicator’s bands, which act as dynamic Support And Resistance levels. Fractal arrows typically appear around these bands, signaling a possible reversal. Its straightforward design allows traders to act quickly, making it as simple as buying on a green arrow and selling on a red arrow.
Using the True Fractal Band MTF Indicator Across Timeframes
This indicator can be applied to any timeframe, though the probability of accurate signals increases on higher timeframes such as H4 or D1. By analyzing larger timeframes, traders can filter out noise and focus on stronger reversal signals.
The GBPUSD chart on the D1 timeframe demonstrates the indicator’s buy and sell signals clearly. The indicator consists of two extreme bands and a midline, with fractal arrows appearing near the bands. The extreme bands act as support and resistance levels, while the midline represents an average price level.
Trading Strategies Using the True Fractal Band MTF Indicator
For a buying opportunity, wait until the price touches the lower extreme band and a green fractal arrow appears. Enter a long position only after a bullish candle closes, confirming price rejection. Place a stop-loss just below the fractal level, and consider taking profits when the price reaches the midline or when a red fractal appears.
For a selling opportunity, wait for the price to hit the upper extreme band and observe a red fractal arrow. Confirm the setup with the close of a bearish candle, then enter a short position. Place a stop-loss just above the fractal level and take profit around the midline or toward the lower extreme band.
Although the True Fractal Band MTF Indicator belongs to the trend family, it does not provide broad trend confirmation. The bands tend to stay close to the price, which can result in several false signals during strong momentum periods. To improve accuracy, consider combining this indicator with other tools or Price Action analysis.
Benefits of the True Fractal Band MTF Indicator
Simple visual signals with green and red fractal arrows
Dynamic support and resistance bands
Works on multiple timeframes for versatile trading
Easy integration into MT4 and algorithmic trading setups
Supports precise entry and exit decisions
Conclusion
The True Fractal Band MTF Indicator for MT4 simplifies trend analysis by visually highlighting potential reversals and support/resistance zones. While false signals may occur in strong trending markets, combining it with other confirmation tools enhances trading accuracy. Explore this indicator and elevate your trading strategy by visiting IndicatorForest.com.
FAQ
5 Downloads
Published:
Dec 09, 2025 13:45 PM
Category: