Maximize Precision with the True Fractals Bands MTF Indicator for MT4
In modern financial markets, identifying the definitive boundaries of asset price movement is the core of any successful technical analysis strategy. While standard volatility envelopes like Bollinger Bands or Keltner Channels are popular among retail traders, they frequently suffer from mathematical lag and over-sensitivity to sudden volume spikes. This structural limitation causes channels to expand too widely, leaving traders with ambiguous entry and exit coordinates. The True Fractals Bands MTF indicator for MetaTrader 4 (MT4) provides an advanced algorithmic solution, combining Bill Williams' fractal geometry with multi-timeframe (MTF) infrastructure to map institutional Support And Resistance zones.
What is the True Fractals Bands MTF Indicator?
The True Fractals Bands MTF indicator is a sophisticated chart overlay system that tracks structural geometric shifts across multiple time horizons simultaneously. Instead of calculating historical standard deviations or price averages, its engine isolates true market pivots—points where Price Action physically changed direction over a designated look-back matrix.
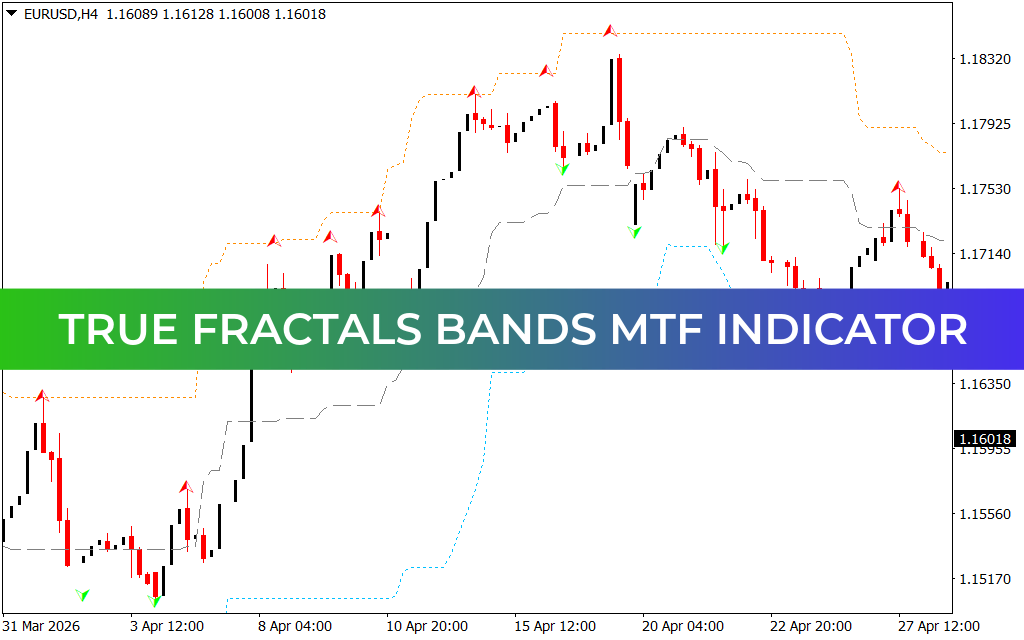
The indicator maps these behavioral extremes directly onto your live workspace, utilizing a highly distinct, non-repainting channel envelope:
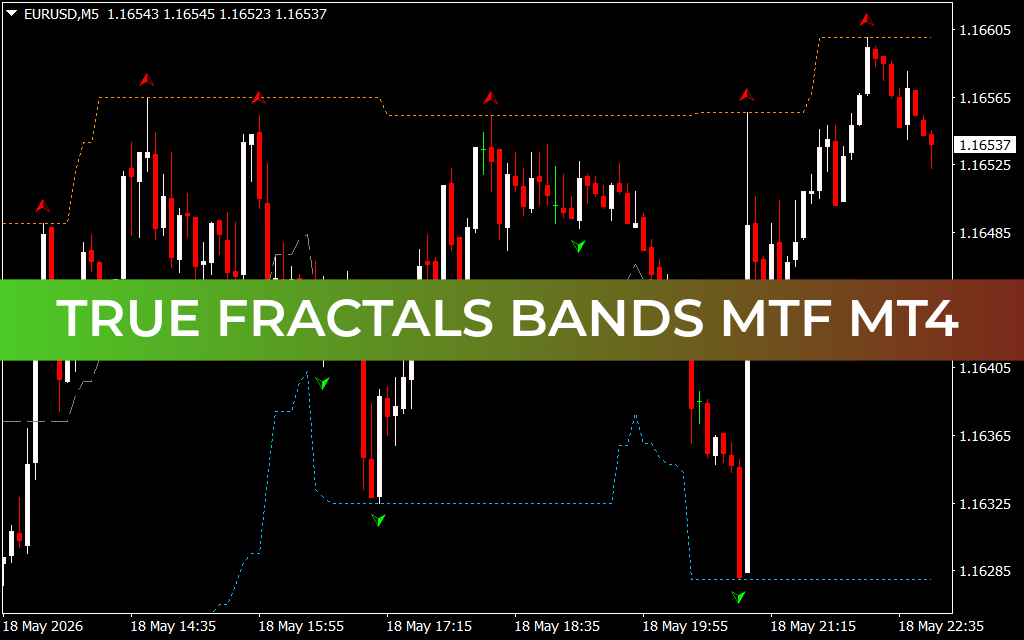
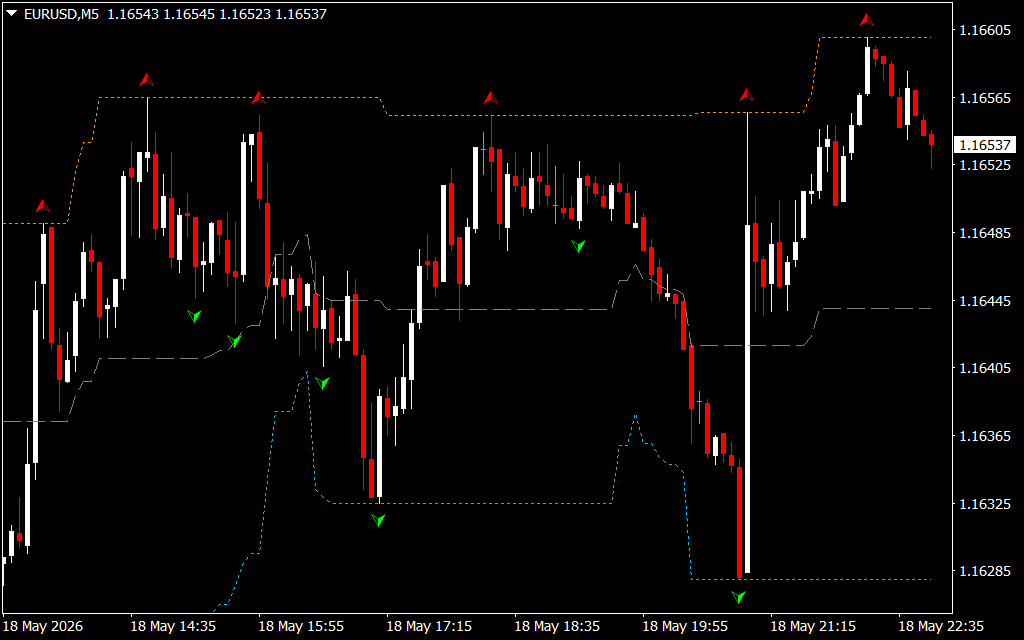
- The Upper Red Band: Represents a dynamic overhead resistance matrix built from higher-timeframe fractal peaks, highlighting major institutional supply zones.
- The Lower Blue Band: Marks a dynamic underlying support matrix calculated from macro fractal troughs, identifying significant accumulation floors.
- The Medium Sea Green Baseline: Acts as an active equilibrium curve or mean-reversion anchor, tracking the immediate structural bias of the session.
As demonstrated on the EURUSD M5 chart, the indicator encases price action flawlessly. The bands adjust smoothly to localized market structure, forming clear horizontal plateaus whenever the market enters a consolidation phase, and expanding symmetrically during massive breakout runs.
Core Strategic Advantages for Technical Analysts
- Multi-Timeframe Synchronization: Traders can overlay Hourly (H1) or 4-Hour (H4) volatility bands directly onto an intraday 5-minute Scalping workspace. This eliminates the need to constantly flip back and forth between chart tabs.
- Objective Boundary Analysis: Because the bands are anchored to fixed fractal geometry rather than shifting mathematical averages, the support and resistance plateaus remain structurally fixed until a definitive price breakout occurs.
- Clutter-Free Market Layout: The tool provides directional bias, volatility expansion, and key pivot levels within a single clean visual script, preserving maximum candlestick visibility.
Practical Trading Implementations
To optimize your daily trade execution using the True Fractals Bands MTF indicator on MT4, implement these two foundational rules:
- The Higher-Timeframe Channel Bounce: Configure the indicator to display H1 fractal bands on your M5 chart. When the intraday price action stretches to touch or pierce the lower blue band, look for a bullish candlestick rejection pattern. Enter a long market order upon verification, placing your protective stop-loss just beneath the blue fractal shelf.
- The Structural Band Breakout: During tight market consolidations, the red and blue bands will compress significantly. Watch for a live candle to close cleanly beyond the upper red band while the baseline turns upward. This breakout signals that institutional capital is driving a fresh expansion phase, providing a high-probability trigger to scale into a momentum position.
3 Downloads
Last Update:
May 19, 2026 02:06 AM
Published:
Jan 19, 2026 20:29 PM
Category: