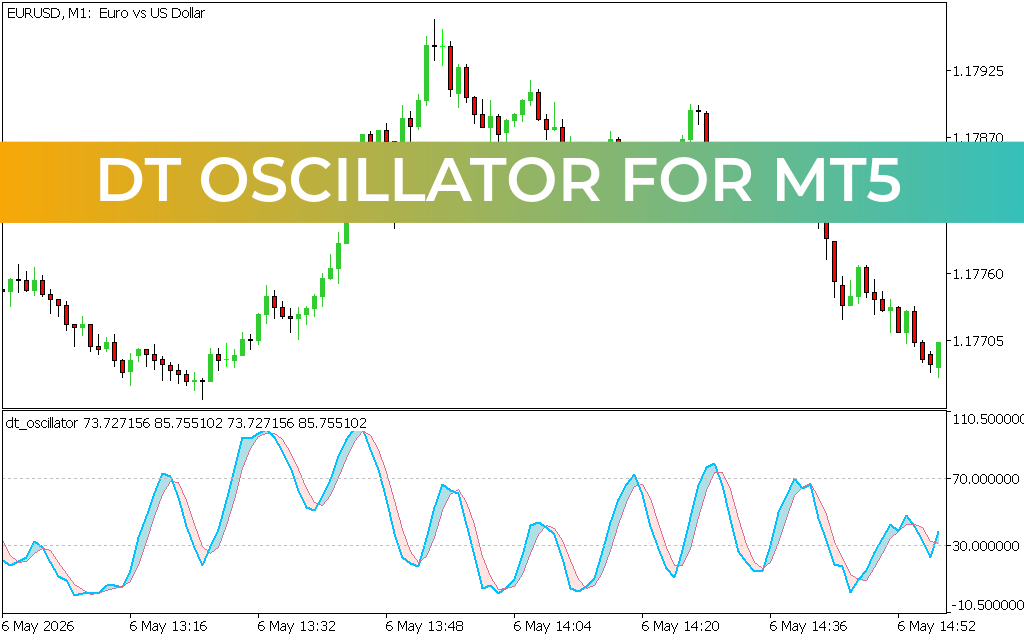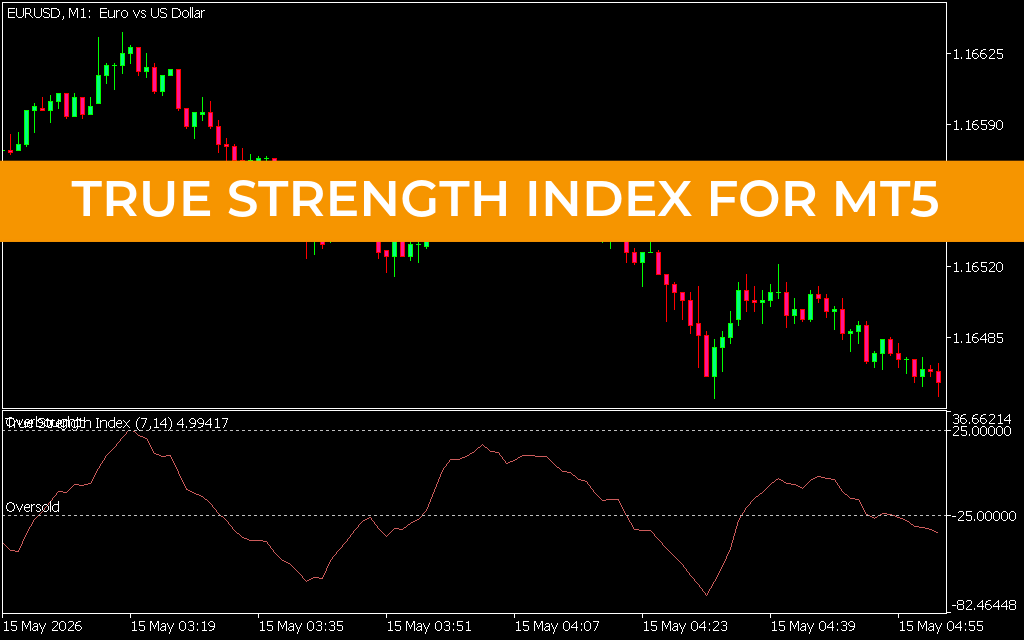
Deciphering Price Momentum: The True Strength Index for MT5
In technical trading, the biggest challenge with traditional momentum oscillators is lag. Standard indicators often lag behind sudden market shifts, leaving day traders and scalpers entering a position just as the move is exhausting itself. To solve this visual and structural bottleneck, professional market participants turn to the True Strength Index (TSI) for MT5—an advanced, double-smoothed momentum oscillator designed to deliver highly accurate trend signals with minimal delay.
Originally developed by William Blau, the True Strength Index takes price momentum and applies a rigorous double-filtering process using exponential moving averages. This mathematical foundation allows the TSI to respond swiftly to real-time micro-trends while filtering out the erratic market noise that plagues liquid currency pairs like the EUR/USD.
Master the True Strength Index Extremes
The indicator is mapped out in a dedicated sub-window beneath your main Price Action screen. It features a responsive, fluid signal line moving across fixed thresholds to highlight clear institutional turning points:
- Identifying Overbought Conditions: The upper boundary (typically set at +25.00000) represents the overbought threshold. When the TSI line climbs above this level, it signals that the current bullish leg is overextended. Savvy traders look for the line to curl back down as confirmation that institutional buying volume is drying up.
- Pinpointing Oversold Reversals: Conversely, the lower boundary (set at -25.00000) marks the oversold region. When market sellers drive the price aggressively downward, the TSI plunges below this level. A sharp, upward hook out of this deep oversold territory acts as an early warning system that a powerful bullish correction or market bottom is forming.
- The Baseline Equilibrium: The zero-line functions as the ultimate momentum referee. When the TSI line is sustained above zero, bulls control the overall market bias. When it hovers below zero, the bears maintain absolute structural dominance.
Perfecting High-Frequency Trade Execution
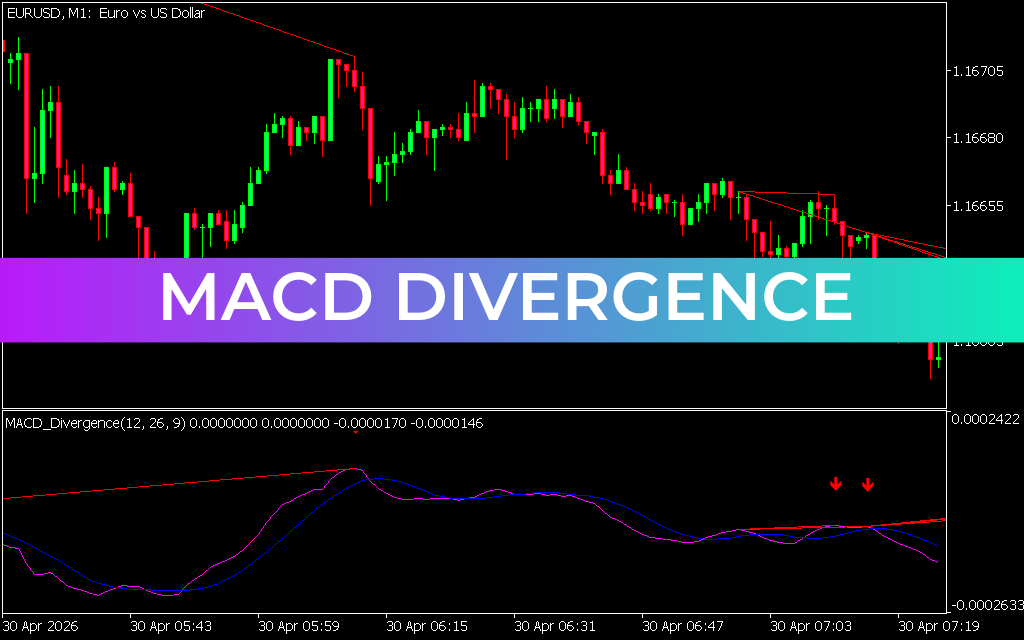
The True Strength Index for MT5 shines brightest when used on lower timeframes like the 1-minute (M1) chart, where precision timing is a necessity. High-frequency scalpers can easily spot divergence setups—where price action prints a lower low but the TSI indicator prints a higher low—to capture explosive sixty-second reversals before the rest of the retail market reacts.
By integrating this double-smoothed momentum powerhouse into your MetaTrader 5 ecosystem, you replace guesswork with objective, mathematical clarity. It bridges the gap between raw Candlestick Patterns and pure momentum velocity, giving you the edge needed to trade with absolute confidence.
2 Downloads
Last Update:
May 17, 2026 16:03 PM
Published:
Jan 20, 2026 21:37 PM
Category: