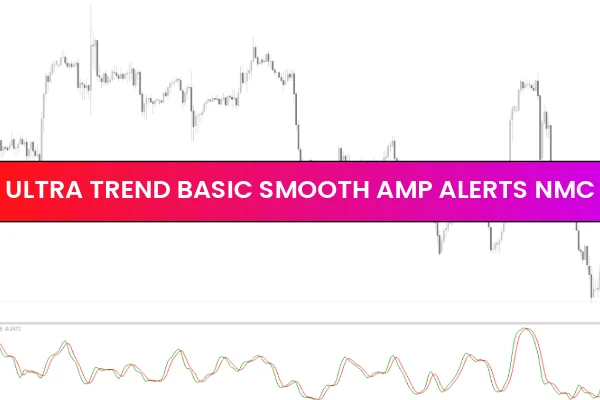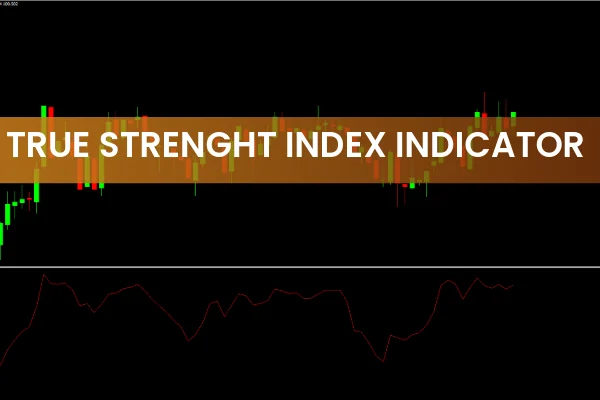
The True Strength Index (TSI) indicator for MetaTrader is a momentum-based oscillator designed to measure the strength and direction of a trend. It’s a highly responsive tool that helps traders identify when market momentum is shifting — a key element in successful forex trading.

The indicator was developed to filter out price noise while providing smoother readings compared to traditional oscillators. It works on all timeframes and trading instruments, making it suitable for Scalping, intraday, and swing trading.
How to Read the True Strength Index
The True Strength Index consists of a single oscillating line that moves above and below a centerline (0.00).
When the TSI line is above 0.00, it indicates bullish momentum, signaling that buyers are in control.
When the TSI line is below 0.00, it indicates bearish momentum, suggesting that sellers dominate the market.
This simple interpretation makes it a reliable tool for identifying momentum shifts and trend confirmation.
How To Trade With the True Strength Index Indicator
The True Strength Index Indicator doesn’t generate explicit BUY or SELL signals. Instead, it’s designed to reveal the underlying strength of market momentum, which traders can use in combination with other tools.
Here’s how to use it effectively:
Combine with Price Action
Use support and resistance zones or candlestick patterns to confirm entries.
For instance, if TSI is above 0 and price forms a bullish engulfing candle near support, it strengthens the BUY case.
Pair with Other Technical Indicators
Combine TSI with moving averages, RSI, or MACD to validate momentum strength.
A crossover or confluence between TSI and another indicator increases trade accuracy.
Identifying Overbought/Oversold Conditions
Although TSI doesn’t have fixed overbought or oversold levels, you can:
Observe extreme peaks or troughs for potential reversals.
Watch for divergence between price and TSI (e.g., price makes a new high but TSI does not — a possible reversal warning).
Practical Example
When the TSI line rises above 0, it confirms bullish momentum. Traders can then look for pullbacks or retracements to enter long positions.
Conversely, when the TSI drops below 0, bearish momentum is confirmed, suggesting short opportunities.
For exit strategies, traders can monitor for momentum weakening or TSI crossing back over the zero line in the opposite direction.
Advantages of the True Strength Index Indicator
Accurate momentum tracking: Clearly defines the strength of price movements.
Lag-free response: Reacts quickly to momentum changes without excessive noise.
Flexible usage: Works across different timeframes and trading styles.
Simple interpretation: Easy for beginners yet effective for professionals.
Conclusion
The True Strength Index Indicator for MT4 is an invaluable momentum tool for forex traders. It helps monitor Trend Strength, identify potential reversals, and confirm trade setups.
While it doesn’t produce direct trading signals, it becomes a powerful confirmation indicator when used alongside Price Action or other technical tools.
Download the True Strength Index Indicator today at IndicatorForest.com and enhance your trading precision with better momentum insights.
FAQ
Published:
Nov 11, 2025 09:52 AM
Category: