Mastering Momentum with the TSI Indicator for MT5
In the modern trading landscape, speed and accuracy are the dual pillars of success. To navigate the volatile Forex and CFD markets, professional traders rely on momentum oscillators that can filter out market noise while maintaining responsiveness to genuine price shifts. The TSI (True Strength Index) Indicator for MetaTrader 5 (MT5) is an elite momentum tool that utilizes a double-smoothing process to provide a cleaner, more reliable view of market strength than traditional oscillators like the RSI or Stochastic.
The Science of Double Smoothing
Developed by William Blau, the True Strength Index is unique because it addresses the inherent "lag" and "choppiness" found in standard indicators. The TSI formula applies an Exponential Moving Average (EMA) to price changes and then applies a second EMA to that initial result. This double-smoothing process effectively removes minor price fluctuations (noise) while highlighting the underlying momentum trend.
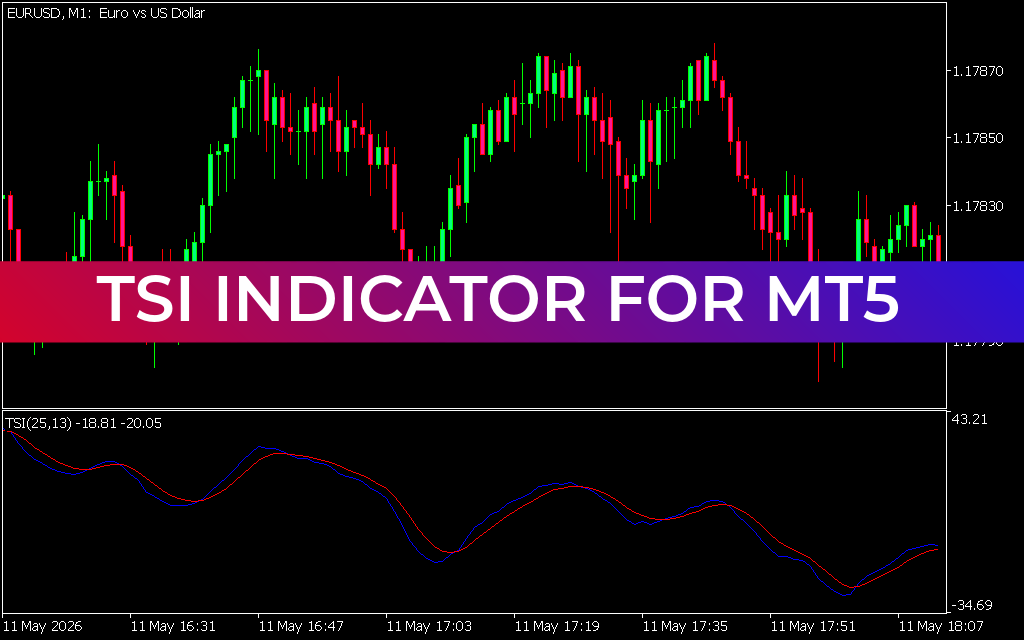
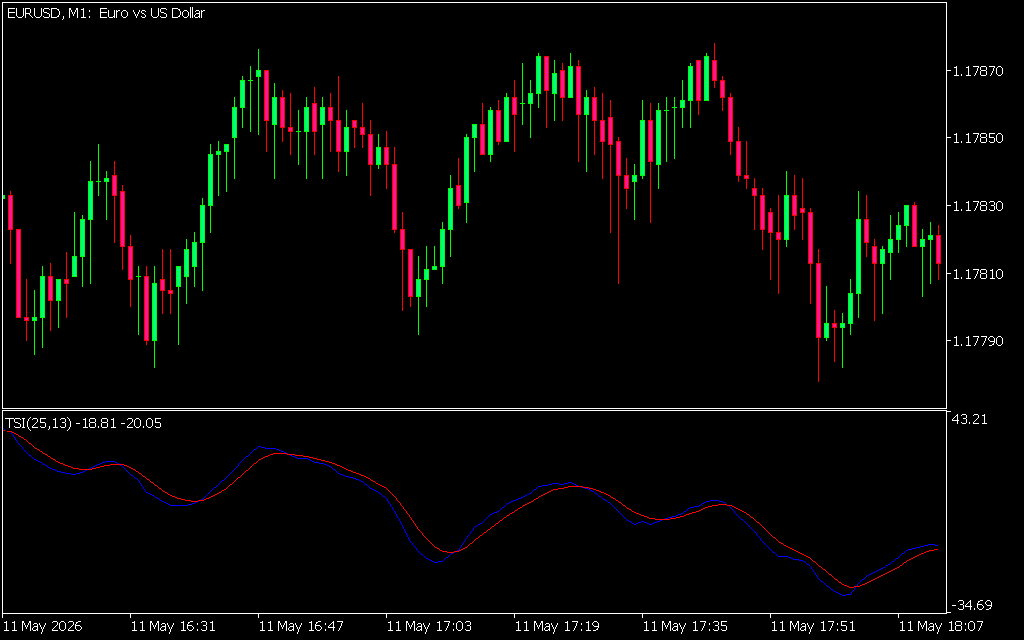
As demonstrated in the EUR/USD M1 chart, the TSI appears in a separate sub-window consisting of two primary lines:
- The TSI Line (Blue): The primary momentum oscillator that tracks the strength of the trend.
- The Signal Line (Red): An EMA of the TSI line itself, used to generate precise crossover entries.
- The Zero Line: A critical threshold that separates bullish momentum (above zero) from bearish momentum (below zero).
High-Probability Trading Signals
The TSI Indicator for MT5 offers several versatile ways to interpret market data and execute high-probability trades:
- Signal Line Crossovers: This is the most common entry method. A bullish signal is generated when the blue TSI line crosses above the red signal line, particularly when coming from deeply negative territory. A bearish signal occurs when the blue line crosses below the red line at a peak.
- Zero Line Rejections and Breaks: The zero line acts as a "momentum pivot." When the TSI crosses from negative to positive, it confirms that bulls have seized control of the market. Conversely, a cross below zero indicates a dominant bearish regime.
- Divergence Detection: The TSI is world-class at spotting "hidden" momentum shifts. If the price makes a new high but the TSI makes a lower high, it signals that the trend is losing internal strength and a reversal may be imminent.
- Overbought and Oversold Extremes: While the TSI does not have fixed boundaries like the RSI, extreme readings far from the zero line indicate that the market is overextended and a mean-reversion move toward the midline is likely.
Why Professional Traders Choose the MT5 Version
The MetaTrader 5 version of the TSI indicator is optimized for high-performance charting. Whether you are a scalper looking for quick momentum bursts on the M1 timeframe or a swing trader identifying major reversals on the Daily chart, the TSI provides a "smooth" signal that is easy to read under pressure. Unlike jagged oscillators that cause frequent "whipsaws," the TSI’s double-smoothed logic ensures you stay in the trend as long as the momentum remains valid.
By integrating the TSI Indicator into your MT5 strategy, you move beyond reacting to price spikes and start trading the true strength of the market. It is an essential utility for anyone serious about mastering technical analysis and momentum-based trading.
1 Download
Last Update:
May 11, 2026 22:09 PM
Published:
Jan 24, 2026 13:04 PM
Category: