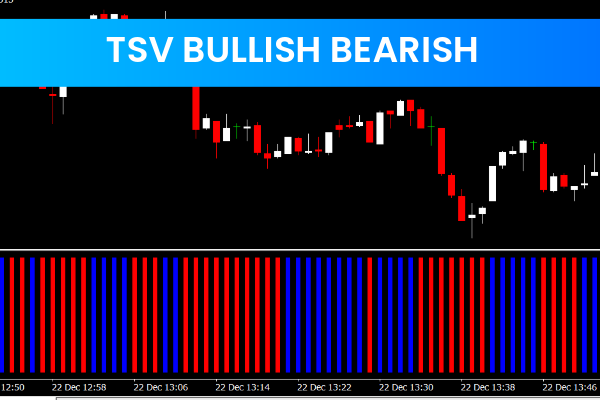
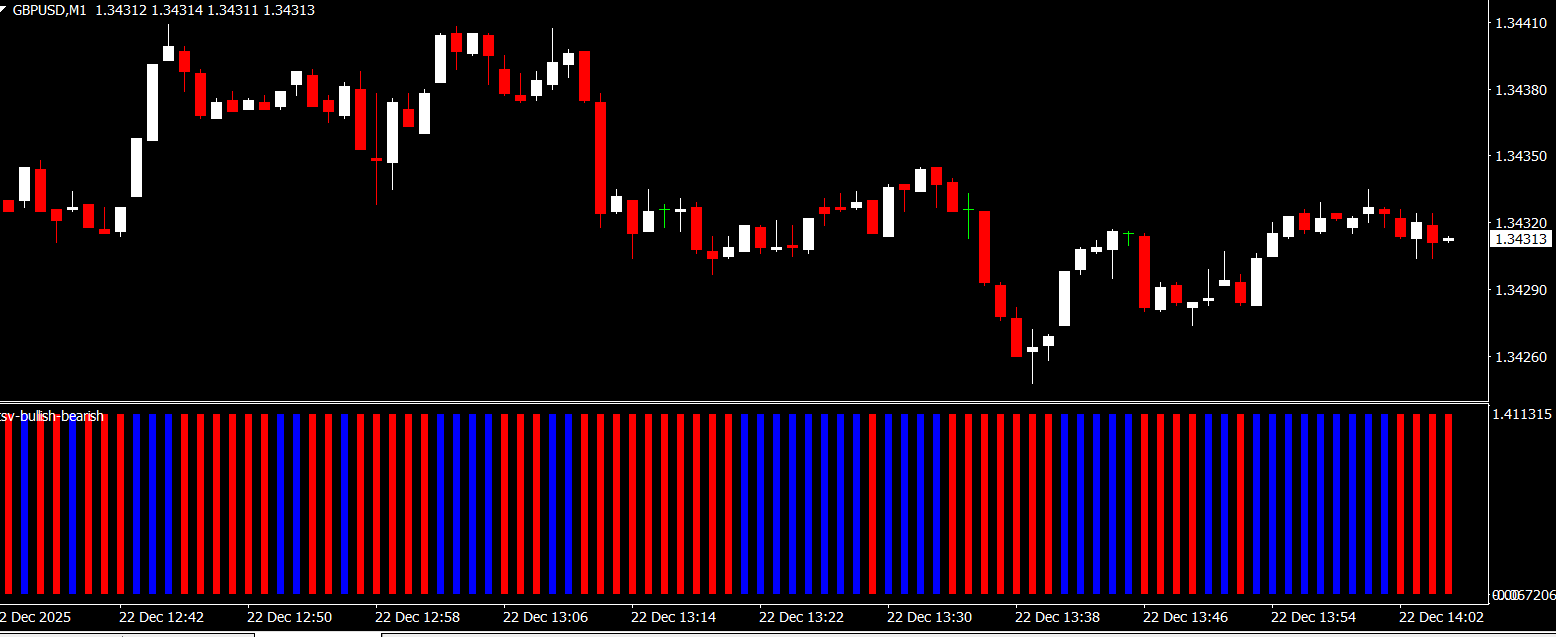
The TSV Bullish Bearish Forex Indicator MT4 is a popular and free trading tool designed to help Forex traders identify potential trend reversals with speed and clarity. This indicator is especially useful for traders who focus on short-term opportunities and want visual confirmation of changing market conditions.
By combining moving averages, trend lines, and Support And Resistance analysis, the TSV Bullish Bearish Forex Indicator MT4 highlights bullish and bearish signals directly on the chart. This makes it easier to spot possible reversals before strong price movements begin.
What Is the TSV Bullish Bearish Forex Indicator MT4
The TSV Bullish Bearish Forex Indicator MT4 is built to quickly detect changes in market direction. It analyzes price behavior using multiple technical components and then displays clear arrow signals that indicate whether bullish or bearish pressure is increasing.
Green arrows represent bullish reversal signals, while red arrows indicate bearish reversal signals. These arrows appear at the bottom of the chart, allowing traders to instantly recognize potential trade opportunities without complex calculations.
How the TSV Bullish Bearish Forex Indicator MT4 Works
The indicator evaluates market structure using:
Moving averages to track trend direction
Trend lines to confirm momentum changes
Support and resistance levels to detect key price zones
When these elements align, the indicator generates a visual signal.
A green arrow suggests the market may reverse upward, while a red arrow suggests a potential downward reversal.
Because these signals are generated early, traders can prepare for entries before major price moves occur.
Key Features of TSV Bullish Bearish Forex Indicator MT4
Bullish and bearish arrow signals
Identifies potential trend reversals
Uses moving averages and support resistance
Clear visual alerts on the chart
Works on all MT4 timeframes
Compatible with all currency pairs
Customizable settings level
Free to download and use
These features make the indicator both flexible and trader-friendly.
How to Use TSV Bullish Bearish Forex Indicator MT4
Bullish Trade Setup
When a green arrow appears, it suggests bullish momentum may be starting. Traders can look for buy entries, ideally near support levels or in alignment with higher-timeframe trends.
Bearish Trade Setup
When a red arrow appears, it signals potential bearish momentum. Traders may look for sell opportunities, especially near resistance zones.
Short-Term Trading Use
This indicator is particularly effective for Scalping and intraday trading, where early reversal detection is critical.
Best Indicator Combinations
For higher accuracy, the TSV Bullish Bearish Forex Indicator MT4 can be combined with:
RSI for overbought and oversold confirmation
Moving averages for trend filtering
Candlestick patterns
Breakout confirmation tools
Using confirmation reduces false signals and improves consistency.
Benefits of Using TSV Bullish Bearish Forex Indicator MT4
Quickly identifies bullish and bearish reversals
Helps traders enter trades earlier
Reduces guesswork and emotional trading
Easy to understand for beginners
Effective for short-term trading strategies
Its simplicity and speed make it ideal for active traders.
Who Should Use This Indicator
The TSV Bullish Bearish Forex Indicator MT4 is suitable for:
Short-term Forex traders
Scalpers and day traders
Beginners learning reversal trading
MT4 users seeking free signal indicators
It adapts well to different trading styles and market conditions.
Final Thoughts
The TSV Bullish Bearish Forex Indicator MT4 is a powerful yet simple tool that helps traders detect potential trend reversals using clear bullish and bearish arrow signals. By combining multiple technical elements into one indicator, it delivers actionable signals without complexity.
If you are looking for a free MT4 indicator to improve timing and catch early reversals, the TSV Bullish Bearish Forex Indicator MT4 is an excellent choice. Visit IndicatorForest.com to download this indicator and explore more professional Forex tools designed to support smarter trading decisions.
FAQ
2 Downloads
Published:
Dec 22, 2025 08:07 AM
Category: