Navigating Market Trends: The U-Lin Regr Buf MTF Indicator Explained
In technical analysis, standard moving averages frequently suffer from lag, causing traders to enter trends late or get caught in sudden reversals. To overcome this limitation, quantitative analysts utilize linear regression algorithms to map the market's true mathematical trajectory. The U-Lin Regr Buf MTF Indicator takes this concept to the next level by combining an optimized, low-lag linear regression curve with Multi-Timeframe (MTF) buffering capabilities, providing an institutional-grade view of trend direction directly on your trading terminal.
Here is a look at how this advanced indicator works across different charts and how to use it to refine your market edge.
The Science of Linear Regression in Forex
Linear regression is a statistical method that fits a straight line through a series of price data points using the "least squares" method to minimize the distance between the line and the actual price candles. Unlike a simple moving average that merely averages historical points, linear regression determines the current mathematical fair value and mathematical slope of the market.
The "U-Lin Regr Buf MTF" variant enhances this calculation, providing incredibly smooth, stepped regression bands across multiple timeframes. This structural smoothing eliminates minor price noise while cleanly exposing the core macroeconomic or intraday trend.
Decoding the Multi-Timeframe Structure
The real power of this indicator lies in its Multi-Timeframe (MTF) functionality. Instead of manually switching back and forth between charts, the indicator projects higher-timeframe statistical boundaries directly onto your execution terminal.
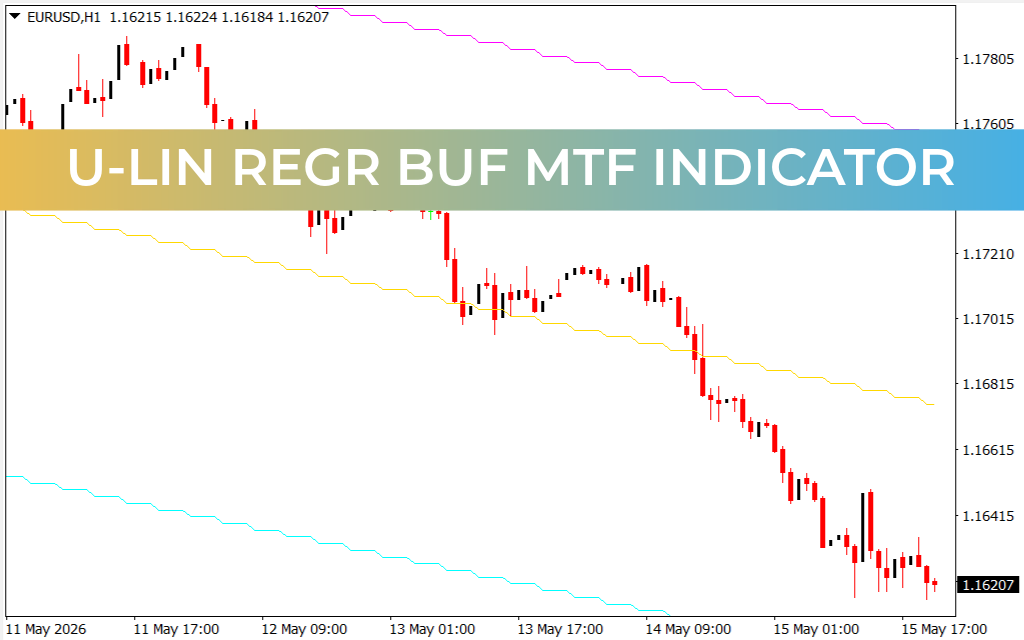
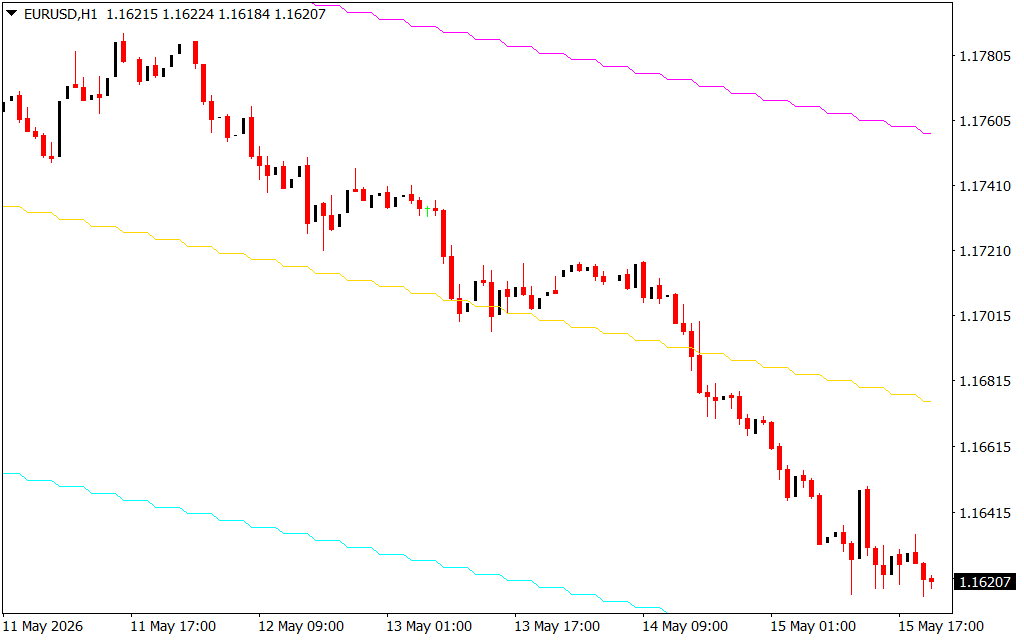
As showcased across the provided EUR/USD chart templates (M15, M5, and H1), the indicator maps clear, stepped tracking bands:
- The Higher-Timeframe Horizon (H1 Chart): On the hourly chart, the indicator plots broad, colorful regression lines—such as the yellow, pink, and cyan steps—mapping a massive macro-liquidation trend.
- Intraday Confluence (M15 & M5 Charts): When dropped down to lower timeframes like the 5-minute or 15-minute charts, these exact same higher-timeframe boundaries remain visible as fixed structural steps. This allows traders to see precisely where an lower-timeframe rally is hitting a higher-timeframe regression wall.
When Price Action remains firmly capped below the downward-sloping regression steps, the indicator provides concrete structural evidence that institutional distribution is underway, warning traders to prioritize short setups.
Strategic Application for Trend Trading
To maximize your performance using the U-Lin Regr Buf MTF indicator, implement these professional guidelines:
- Trade in Directional Harmony: Always identify the slope of the regression bands on the higher timeframes (such as the H1). If the steps are moving downward, only search for short entries on your execution timeframes (M5 or M15).
- Dynamic Support And Resistance: Treat the stepped regression bands as dynamic institutional boundaries. When price pulls back upward to touch a declining yellow or pink regression line, look for candlestick exhaustion patterns to trigger a high-probability continuation entry.
- Objective Stop Placement: Place your defensive stop-loss orders just past the nearest higher-timeframe regression step. If price breaks structurally beyond a regression level, it mathematically invalidates the current trend thesis.
1 Download
Last Update:
May 17, 2026 01:53 AM
Published:
Jan 20, 2026 23:01 PM
Category: